![]()
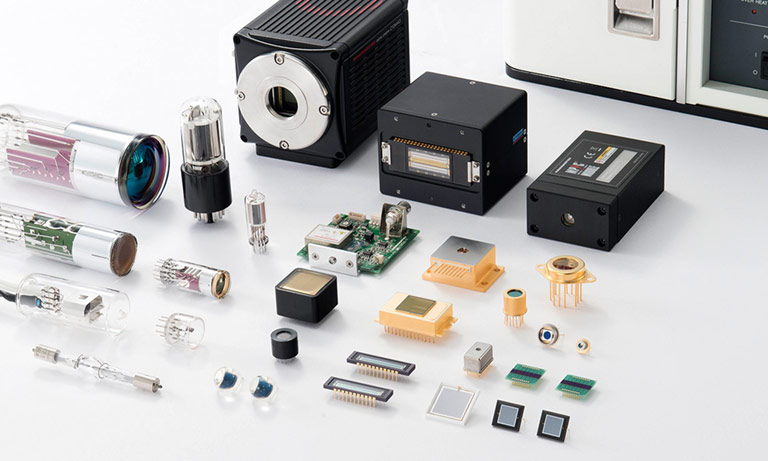
Products


We are actively taking measures to improve product quality levels.
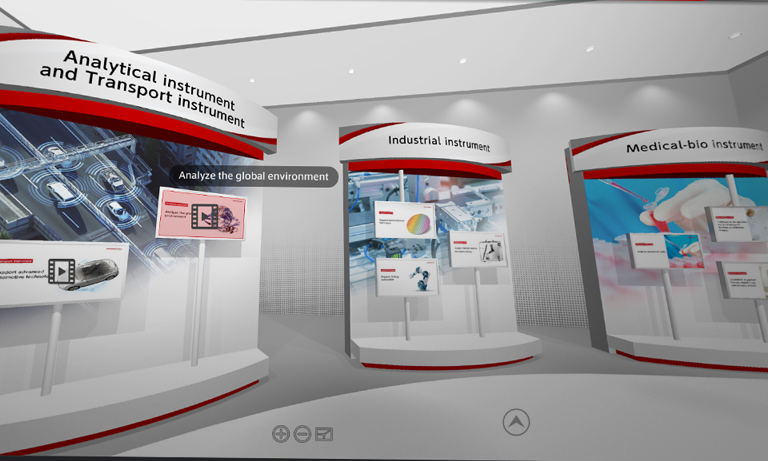
Applications


Why Hamamatsu?
Support


Our company


Investors


Japan (EN)
Select your region or country.
Reducing carbon emissions and climate change
Long-Term Vision of Global Warming Countermeasures
In recent years, the problems caused by climate change, such as extreme weather (droughts, heat waves, and heavy rain, etc.), as well as the increasing number of natural disasters, which were traditionally thought to occur once every 50 years, have been imposing serious impacts in many parts of the world. In addition to strengthening business continuity, companies are also required to take measures against climate change in terms of both mitigation and adaptation. In March 2020, we formulated our Long-term Vision of Global Warming Countermeasures, and are working to cut greenhouse gas emissions (scope 1 and 2*) from our business activities.
In the fiscal year under review, CO2 emissions were reduced by 13.9 % from the fiscal year ended March 31, 2006, achieving the target of 10 % or more, mainly due to the introduction of renewable energy. In addition to energy-derived CO2 emissions, we have been working on measures to reduce the emission of PFC, SF6, and other semiconductor manufacturing gases that contribute to global warming by introducing combustion and plasma abatement equipment since FY2006.


Trends in energy usage and carbon emissions
We are working on energy conservation activities to achieve our mid-term target of "improving unit energy consumption in the 84th fiscal year (ending September 30, 2031) by 10 % or more compared to the 74th fiscal year (ending September 30, 2021).
In the current fiscal year, we achieved the target of 10 % or more by reducing energy consumption rate per unit of production by 16.4 % compared to the 74th fiscal year through energy-saving measures in buildings and active introduction of equipment subject to the Top Runner Program.
We will continue to promote energy conservation and global warming prevention activities.

*Calculation scope: Hamamatsu Photonics K.K.
Renewable energy
Hamamatsu Photonics is working hard to reduce carbon emissions by advancing the implementation of renewables such as solar and wind power. At Toyooka Factory, we have installed solar-power generating equipment (250 kW) on the walls and roof of No. 10 Building in collaboration with our solar power business. On the premises of the Central Research Laboratory, we combines solar-power generation with small-scale wind-power generation, in a hybrid solution for outdoor lighting. As of October 2022, we have implemented a cumulative total 1,123 kW of renewable energy.
In October 2018, we commenced purchasing of Chubu Electric’s “CO2-free Electricity,” expanding our introduction of renewables.
| Renewable-energy target | Renewable-energy usage rate: 60 % (FY2030) 100 % (FY2040) |
|---|---|
| FY2022 | 14.6 % (as of September 2022) |
*Calculation scope: Hamamatsu Photonics K.K. and consolidated subsidiaries

Solar-power generating equipment (Toyooka Factory)

Solar-power generating equipment (Shingai Factory)

Hybrid wind/solar-powered exterior lighting (Central Research Laboratory)

Solar-power generating equipment (Main Factory)
Value chain carbon emissions
To grasp the environmental impact of the value chain*2, HPK is working on the calculation of Scope 3 (shown below) which is based on the Greenhouse Gas (GHG) Protocol.
Going forward, we will expand the calculation scope of Scope 3, improve
accuracy, and strive to reduce emissions throughout the value chain.
| Category | FY2020 emission volume | FY2021 emission volume | FY2022 emission volume | |||
|---|---|---|---|---|---|---|
| Emission volume (t-CO2) | Share of total (%) | Emission volume (t-CO2) | Share of total (%) | Emission volume (t-CO2) | Share of total (%) | |
| Scope 1 (direct emissions: use of fuel, etc.) | 12,796 | 2.0 | 12,599 | 2.1 | 11,233 | 1.5 |
| Scope 2 (indirect emissions: use of purchased electricity, etc.) | 49,979 | 7.7 | 46,638 | 7.7 | 46,271 | 6.2 |
| Scope 3 (other indirect emissions) | 588,298 | 90.4 | 542,845 | 90.2 | 685,923 | 92.3 |
| 1. Purchased goods and services | (361,786) | (61.5) | (356,721) | (65.7) | (408,044) | (59.5) |
| 2. Capital goods | (116,511) | (19.8) | (53,214) | (9.8) | (98,641) | (14.4) |
| 3. Fuel and energy use not included in scopes 1 and 2 | (11,185) | (1.9) | (11,361) | (2.1) | (10,811) | (1.6) |
| 4. Transport and delivery (upstream) | (8,640) | (1.5) | (11,167) | (2.1) | (17,747) | (2.6) |
| 5. Waste generated by business activities | (448) | (0.1) | (489) | (0.1) | (486) | (0.1) |
| 6. Business travel | (882) | (0.2) | (183) | (0.0) | (754) | (0.1) |
| 7. Commuting by employees | (5,680) | (1.0) | (5,812) | (1.1) | (5,995) | (0.9) |
| 8. Lease assets (upstream) | ─ | ─ | ─ | ─ | ─ | ─ |
| 9. Transport and delivery (downstream) | ─ | ─ | ─ | ─ | ─ | ─ |
| 10. Processing of sold products | (4,339) | (0.7) | (5,464) | (1.0) | (7,176) | (1.1) |
| 11. Use of sold products | (78,541) | (13.4) | (98,088) | (18.1) | (135,912) | (19.8) |
| 12. Disposal of sold products | (287) | (0.1) | (344) | (0.1) | (358) | (0.1) |
| 13. Lease assets (downstream) | ─ | ─ | ─ | ─ | ─ | ─ |
| 14. Franchises | ─ | ─ | ─ | ─ | ─ | ─ |
| 15. Investments | ─ | ─ | ─ | ─ | ─ | ─ |
*2 The entire series of processes involving products, including material procurement, production, logistics, use and disposal. Includes both upstream and downstream parts of the Company’s supply chain.
Method of calculation of scope 3
| Category | Activity volume | Unit |
|---|---|---|
| 1. Purchased goods and services | Amount of purchases of raw materials and parts | Emissions per unit amount of purchase |
| 2. Capital goods | Monetary amount of capital goods purchased | Emissions per unit amount of purchase |
| 3. Fuel and energy use not included in scopes 1 and 2 | Fuel, electricity, and heat energy use | Emissions per unit of electricity and fuel used |
| 4. Transport and delivery (upstream) | • Shipping volume related to purchased products and services • Cost of shipping of sold products |
• Emission rate (corrected t/kg method) • Emission rate by shipping method |
| 5. Waste generated by business activities | Output volume by type of waste | Output rate by type of waste |
| 6. Business travel | • Distance traveled • Traveling expenses paid |
Emission rate by transportation mode |
| 7. Commuting by employees | • Distance traveled • Commuting expenses paid |
Emission rate by commuting mode |
| 8. Lease assets (upstream) | N/A | ─ |
| 9. Transport and delivery (downstream) | N/A | ─ |
| 10. Processing of sold products | Sales of products | Manufacturing emissions intensity by sector |
| 11. Use of sold products | Final products: Number of units shipped, power consumption and service life | Proxy value for CO2 emission coefficient by electricity provider (the Ministry of the Environment) |
| 12. Disposal of sold products | Final products: Number of units shipped and product weight | Emission rate by product type |
| 13. Lease assets (downstream) | N/A | ─ |
| 14. Franchises | N/A | ─ |
| 15. Investments | N/A | ─ |
Third-party Verification of greenhouse gas emissions based on ISO 14064-3
To provide and publish transparent and reliable information on the greenhouse gas emissions data calculated by Hamamatsu Photonics (scope 1, 2, and 3), we obtained third-party verification by SGS Japan Inc., and their written opinion. We will continue to work to improve the reliability of its data and reduce greenhouse gas emissions.
<FY2016>
Verification statement [503 KB/PDF]
<FY2018>
Verification statement [235 KB/PDF]
<FY2019>
Verification statement [1.76 MB/PDF]
<FY2020>
Verification statement [773 KB/PDF]
<FY2021>
Verification statement [1.36 MB/PDF]
<FY2022>
Verification statement [1.38 MB/PDF]
Response to the fluorocarbon emission control act
The Revised Fluorocarbons Recovery and Destruction Law, which was drafted for the purpose of preventing global warming caused by leaks of GHGs substitutes, was enacted in April 2015.
We are promoting compliance with this law by assigning a control number to each relevant equipment and using a database for managing that equipment information and inspection records. We perform appropriate simple inspections and periodic inspections on the subject equipment. When an abnormality is identified, the equipment is serviced and repaired as soon as possible. We use a database to keep a history of inspections, etc. The amount of leakage per fiscal year is calculated from the database and confirmed to be less than 1,000 t-CO2.
When disposing of the subject equipment, we comply with the regulations by requesting collection from a Fluorocarbons Recovery Operators and preserving the certificate.
In each division and business site, we conduct education activities covering laws and regulations as well as internal management methods for the administrators.

Control number sticker
Reductions in GHG emissions
GHG used in semiconductor manufacturing such as HFC, PFC, SF6 and NF3 have large global warming potential(GWP). We are working to reduce its emissions by installing removal devices and optimizing processes.
< medium- and long-term target >
Reduction of non-energy greenhouse gas emissions by 44% with FY2013 in FY2030.
< short-term target >
Reduction of non-energy greenhouse gas emissions by 28.5% with FY2013 in FY2024.

Abatement systems
- Confirmation
-
It looks like you're in the . If this is not your location, please select the correct region or country below.
You're headed to Hamamatsu Photonics website for JP (English). If you want to view an other country's site, the optimized information will be provided by selecting options below.
In order to use this website comfortably, we use cookies. For cookie details please see our cookie policy.
- Cookie Policy
-
This website or its third-party tools use cookies, which are necessary to its functioning and required to achieve the purposes illustrated in this cookie policy. By closing the cookie warning banner, scrolling the page, clicking a link or continuing to browse otherwise, you agree to the use of cookies.
Hamamatsu uses cookies in order to enhance your experience on our website and ensure that our website functions.
You can visit this page at any time to learn more about cookies, get the most up to date information on how we use cookies and manage your cookie settings. We will not use cookies for any purpose other than the ones stated, but please note that we reserve the right to update our cookies.
1. What are cookies?
For modern websites to work according to visitor’s expectations, they need to collect certain basic information about visitors. To do this, a site will create small text files which are placed on visitor’s devices (computer or mobile) - these files are known as cookies when you access a website. Cookies are used in order to make websites function and work efficiently. Cookies are uniquely assigned to each visitor and can only be read by a web server in the domain that issued the cookie to the visitor. Cookies cannot be used to run programs or deliver viruses to a visitor’s device.
Cookies do various jobs which make the visitor’s experience of the internet much smoother and more interactive. For instance, cookies are used to remember the visitor’s preferences on sites they visit often, to remember language preference and to help navigate between pages more efficiently. Much, though not all, of the data collected is anonymous, though some of it is designed to detect browsing patterns and approximate geographical location to improve the visitor experience.
Certain type of cookies may require the data subject’s consent before storing them on the computer.
2. What are the different types of cookies?
This website uses two types of cookies:
- First party cookies. For our website, the first party cookies are controlled and maintained by Hamamatsu. No other parties have access to these cookies.
- Third party cookies. These cookies are implemented by organizations outside Hamamatsu. We do not have access to the data in these cookies, but we use these cookies to improve the overall website experience.
3. How do we use cookies?
This website uses cookies for following purposes:
- Certain cookies are necessary for our website to function. These are strictly necessary cookies and are required to enable website access, support navigation or provide relevant content. These cookies direct you to the correct region or country, and support security and ecommerce. Strictly necessary cookies also enforce your privacy preferences. Without these strictly necessary cookies, much of our website will not function.
- Analytics cookies are used to track website usage. This data enables us to improve our website usability, performance and website administration. In our analytics cookies, we do not store any personal identifying information.
- Functionality cookies. These are used to recognize you when you return to our website. This enables us to personalize our content for you, greet you by name and remember your preferences (for example, your choice of language or region).
- These cookies record your visit to our website, the pages you have visited and the links you have followed. We will use this information to make our website and the advertising displayed on it more relevant to your interests. We may also share this information with third parties for this purpose.
Cookies help us help you. Through the use of cookies, we learn what is important to our visitors and we develop and enhance website content and functionality to support your experience. Much of our website can be accessed if cookies are disabled, however certain website functions may not work. And, we believe your current and future visits will be enhanced if cookies are enabled.
4. Which cookies do we use?
There are two ways to manage cookie preferences.
- You can set your cookie preferences on your device or in your browser.
- You can set your cookie preferences at the website level.
If you don’t want to receive cookies, you can modify your browser so that it notifies you when cookies are sent to it or you can refuse cookies altogether. You can also delete cookies that have already been set.
If you wish to restrict or block web browser cookies which are set on your device then you can do this through your browser settings; the Help function within your browser should tell you how. Alternatively, you may wish to visit www.aboutcookies.org, which contains comprehensive information on how to do this on a wide variety of desktop browsers.
5. What are Internet tags and how do we use them with cookies?
Occasionally, we may use internet tags (also known as action tags, single-pixel GIFs, clear GIFs, invisible GIFs and 1-by-1 GIFs) at this site and may deploy these tags/cookies through a third-party advertising partner or a web analytical service partner which may be located and store the respective information (including your IP-address) in a foreign country. These tags/cookies are placed on both online advertisements that bring users to this site and on different pages of this site. We use this technology to measure the visitors' responses to our sites and the effectiveness of our advertising campaigns (including how many times a page is opened and which information is consulted) as well as to evaluate your use of this website. The third-party partner or the web analytical service partner may be able to collect data about visitors to our and other sites because of these internet tags/cookies, may compose reports regarding the website’s activity for us and may provide further services which are related to the use of the website and the internet. They may provide such information to other parties if there is a legal requirement that they do so, or if they hire the other parties to process information on their behalf.
If you would like more information about web tags and cookies associated with on-line advertising or to opt-out of third-party collection of this information, please visit the Network Advertising Initiative website http://www.networkadvertising.org.
6. Analytics and Advertisement Cookies
We use third-party cookies (such as Google Analytics) to track visitors on our website, to get reports about how visitors use the website and to inform, optimize and serve ads based on someone's past visits to our website.
You may opt-out of Google Analytics cookies by the websites provided by Google:
https://tools.google.com/dlpage/gaoptout?hl=en
As provided in this Privacy Policy (Article 5), you can learn more about opt-out cookies by the website provided by Network Advertising Initiative:
http://www.networkadvertising.org
We inform you that in such case you will not be able to wholly use all functions of our website.
Close