![]()
Products


We are actively taking measures to improve product quality levels.
Applications


Why Hamamatsu?
Resources


Support


Our company


Investors


United States (EN)
Select your region or country.
Photodetectors in flow cytometers
Slawomir Piatek, PhD, Hamamatsu Corporation and New Jersey Institute of Technology
Earl Hergert, Hamamatsu Corporation
April 10, 2020
Flow cytometry is a technique that can provide quantitative and qualitative information about biological cells and microparticles. The information is in the light that has interacted with the cells as they pass one after another and one at the time through a narrow region illuminated by one or more lasers. The machine enabling such studies is a flow cytometer, ubiquitous in biomedical, clinical, engineering, and environmental laboratories. Its design consists of fluidics, illumination optics, photodetection, data analysis, and, in some models, cell sorting (Figure 1).
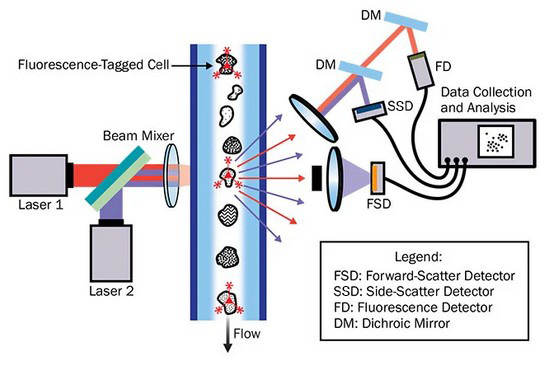
Figure 1. The basic layout of a flow cytometer.
In the fluidics component, a pressurized and filtered sheath fluid flows through a flow cell, a narrow round or rectangular tube whose diameter ranges between 50 μm and 250 μm. The flow is laminar. Upstream, before the laser interrogation point, a liquid, distinct from the sheath fluid, with suspended cells or particles is injected into the central section of the flowing sheath. The liquids do not mix; instead, the faster-flowing sheath accelerates the sample liquid creating a coaxial flow pattern: the inner flow is known as the sample core.
The hydrostatic pressure of the sample core is always higher than that of the sheath; the pressure differential controls the width of the sample core: the typical diameters range between 5 μm and 20 μm. The smaller the pressure differential, the narrower the sample core and the lower the flow rate of the core. Narrowing of the sample core causes the cells to flow near the central axis in a single file formation. This hydrodynamic focusing is essential to ensure that only one cell at a time passes through the laser interrogation point (Figure 2).
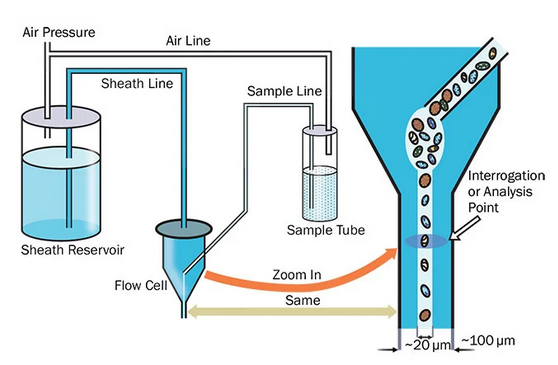
Figure 2. Fluidics and detail of the interrogation process.
A typical flow cytometer uses at least one laser for the illumination of the interrogation point, also known as the analysis point. The analysis point is actually a volume defined by the intersection of the sample core and the laser beam. In this volume, the laser light interacts with the passing cell and also induces fluorescence if the cell is tagged with a fluorescent molecule (known as fluorophore or fluorochrome).
The two requirements of flow cytometry are: 1) only one cell at a time may be present at the analysis point, and 2) each passing cell must be illuminated by the same intensity of light. Violation of the first requirement can lead to cell misidentification because the outgoing light comes from multiple cells at the same time. Violation of the second will result in different quantities of outgoing light from identical cells. To improve the odds of non-violation, the profile of the focused laser beam at the analysis point is an ellipse whose long axis (typically ~60 μm) is perpendicular to the direction of the flow. The short axis (typically ~20 μm) parallel to the flow represents the smallest permissible separation between the flowing cells.
A typical laser outputs a circular beam 1 – 2 mm in diameter with a Gaussian intensity profile. The elliptical illumination is achieved by focusing the light with a cylindrical lens. The average separation between the cells is a function of the cell concentration in the core liquid (ranges from ~ 105 to 5×10⁶ cells per mL) and the core diameter. The sampling rate of the cells depends on this concentration and also on the speed of the core flow; a benchmark rate is about 1,000 cells per second.
There are several considerations in selecting the appropriate light source. It should provide stable illumination at the analysis point without damaging the cells and should excite fluorophores if fluorescence tagging is employed. A laser fulfills these requirements well, though other sources, like an arc lamp, can also be used. Examples of some commonly used lasers are argon ion, helium-neon, and red-diode. Their useful wavelengths are mostly in the 400 – 600 nm range.
At the analysis point the cell can reflect, scatter, diffract, refract, and/or absorb the incident light. The cell can also fluoresce. The importance of these processes depends on the cell’s properties such as size, shape, index of refraction, granularity, and presence of either endogenous or tagged fluorophores. Some fraction of the outgoing light is incident on at least two lenses. The first, placed on the optical axis, collects the forward scatter signal, whose quantity is primarily determined by the cell’s size and index of refraction. The other lens, placed orthogonally to the optical axis, collects the side scattered and fluorescence signals. The former is a function of the cell’s granularity, whereas the latter can be polychromatic and is typically of lower brilliance.
A combination of dichroic mirrors and long-pass and short-pass filters spatially segregates the side scatter and fluorescence light according to wavelength. Each monochromatic component illuminates the active area of a dedicated photodetector, which converts radiant energy into electrical energy. A flow cytometer may utilize some combination of three distinct types of photodetectors depending on the wavelength, intensity, and pulse duration. These photodetectors are a photodiode (PD), avalanche photodiode (APD), and a photomultiplier tube (PMT). A newly developed silicon photomultiplier (SiPM), a photodetector whose sensitivity to light can rival that of a PMT, may become the fourth choice.
Among the many opto-electronic characteristics of a photodetector, three are crucial in flow cytometry: responsivity, dynamic range, and bandwidth. The first is a wavelength-dependent proportionality factor between the incident light power and the photodetector’s output current. The second is the range of incident light powers for which the photodetector outputs a linearly proportional current whose signal-to-noise ratio (SNR) is greater than one. The third can be thought of as the parameter that determines the likeness between the shapes of the output current pulse and of the incident light pulse.
A photodetector is only one part of a complete electronic detection system. Each aforementioned photodetector is essentially a light-driven current source. Either a resistor or current-to-voltage amplifier converts its output current pulse to a voltage pulse, which is then processed electronically to determine the amplitude, width, or area depending on the design and research interests. The quality of these data points, as measured by SNR, depends not only on the opto-electronic characteristics of the photodetector but also on the noise characteristics of the front-end electronics. In addition, the front-end electronics together with the photodetector constrain the detection’s dynamic range and bandwidth.
The forward scatter signal is typically high enough to warrant the use of a PD. It is a semiconductor device with a single PN junction. Most of the PDs in flow cytometry are made of silicon. They have excellent responsivity in the 350 nm – 1,000 nm range, with the maximum of about 0.5 A/W around 900 nm. The peak output current depends on the power of the illuminating laser, properties of the cells, and the diameter of the objective lens. Its typical values are in the μA range, implying peak radiant power in the μW range.
Side scatter and fluorescence signals are weaker than the forward scatter signal. If a PD were to be used, one would expect the peak current on the order of 100s pA to 10s nA. Detecting such currents so that SNR > 1 would require expensive low-noise front-end electronics. An alternative approach is to use a photodetector with an intrinsic gain, such as PMT, APD, or SiPM. In this approach, the intrinsic gain suppresses the importance of noise from the front-end electronics (Figure 3).
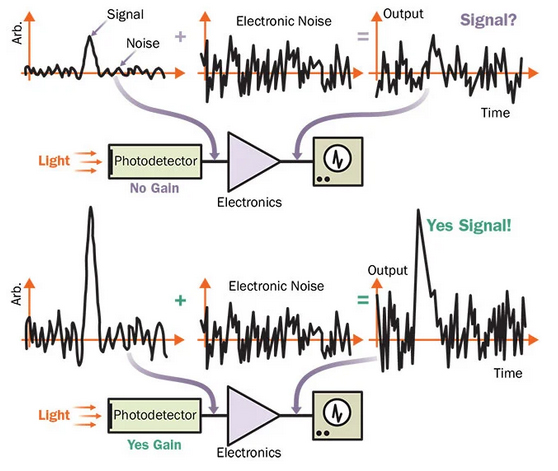
Figure 3. Importance of the photodetector’s intrinsic gain.
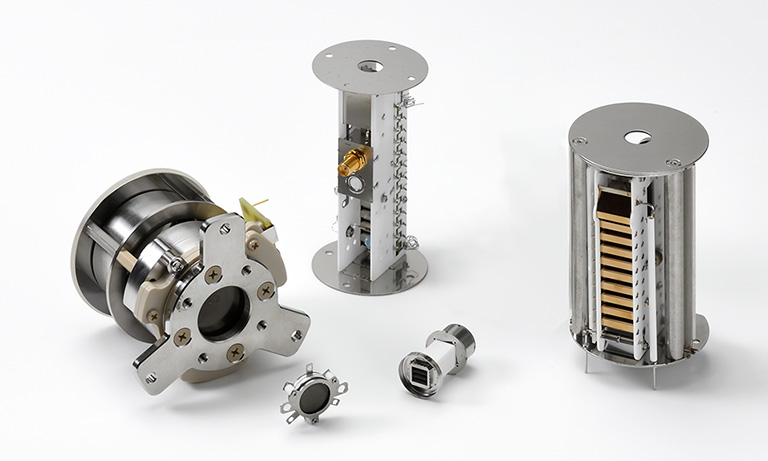
A PMT is a cold vacuum tube whose main structural components are a light-sensitive photocathode, a sequence of dynodes, and an anode (Figure 4). All of these components are electrically biased, with the photocathode at the lowest electrical potential and the anode at the highest (typically at the ground level). A photon incident on the photocathode causes a photoemission of electron into the vacuum. This electron can then initiate electron chain-multiplication in the sequence of dynodes so that, effectively, a single photon can result in a million or so electrons collected at the anode (gain = number of electrons), yielding a typical anode responsivity of about 105 A/W in the visible range. Supply voltage (300 V – 800 V) controls the gain and, thus, anode responsivity. The tradeoff for having intrinsic gain is higher photodetector noise, commonly expressed as excess noise figure. Its typical value for a PMT is 1.2 – 1.4 (an ideal noiseless case is 1).
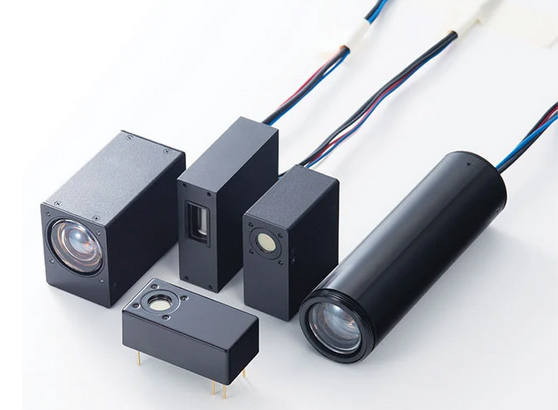
Figure 4. Photomultiplier tube (PMT) modules.
An APD is like a PD albeit with an intrinsic gain. The gain, with a maximum value of about 100, is due to impact ionization of silicon atoms in the depletion region. To achieve it, an APD is reverse-biased to a voltage close to, but less than, the breakdown voltage (150 V – 400 V). With such bias the APD is said to operate in the linear mode. APDs have rather large excess noise, with typical values around 3.5. Biasing an APD above the breakdown voltage makes the APD operate in Geiger mode. (Note that APDs are constructed to operate either in the linear mode or Geiger mode but not both.) In this mode, an APD is effectively a light switch - on or off - and requires an external circuitry to recover from the off state.
Developed in the mid-1990s, an SiPM is a rectangular array of square microcells, all connected in parallel. Each microcell is a series combination of Geiger-mode silicon APD and a quenching resistor, whose role is to make the APD recover from Geiger discharge. SiPMs are small, two-pronged devices requiring a biasing voltage of only tens of volts. Depending on the model, the active area can be from 1×1 to 6×6 mm2, consisting of several hundred to tens of thousands of microcells. The size of a microcell ranges from 10×10 to 100×100 μm2. Dividing active area of an SiPM by the area of its microcells yields the total number of the microcells. This number, together with the dark count rate, are the key parameters affecting the dynamic range of an SiPM.
An SiPM has a gain that is comparable to that of a PMT, and its excess noise is only about 1.1 – 1.2. Moreover, its responsivity and bandwidth resemble those of a PMT too. Examples of additional desirable characteristics are durability, immunity to a magnetic field, no warm-up time, and simpler biasing and readout electronics. Given these advantageous characteristics, should we expect that an SiPM will completely replace a PMT in future generations of flow cytometers?
Predicting the future is difficult, so it might be easier to state why the replacement has not happened already. It is the smaller dynamic range of an SiPM that hampers the transition. Compared to an SiPM, a PMT has lower dark count rate per unit active area. The consequence of this is that a PMT can detect a fainter light signal than an SiPM. As the incident light level increases, both devices will eventually become non-linear and, therefore, approach the upper limit of their dynamic range. In the case of a PMT, it will be when the peak anode current reaches the maximum rating. In the case of an SiPM, the finite number of microcells limits the dynamic range. As the number of photons in a pulse increases, it becomes progressively more likely that more than one photon will illuminate a microcell at a given moment, and that this illumination can occur while the microcell is in the recovery stage.
The upper limit of the given SiPM’s dynamic range cannot be changed: it is constrained by the total number of microcells. However, the lower limit can be extended to fainter light levels by cooling the device, which decreases the dark count rate. Cooling the PMT does the same. The upper limit of the PMT’s dynamic range can be extended in two ways. One is to lower the gain by decreasing the supply voltage, and the other is to use a voltage divider circuit that increases the maximum anode current rating. Neither of these approaches is viable for an SiPM.
Research and development of SiPMs is ongoing, yielding an improved performance with every new generation of the device. As the dark count rates come down and the total number of microcells goes up, the odds that an SiPM becomes a part of a functional flow cytometer are excellent.
See recommended products for flow cytometry.
Meet the authors
Slawomir Piatek, PhD, has been measuring proper motions of nearby galaxies using images obtained with the Hubble Space Telescope as a senior university lecturer of physics at New Jersey Institute of Technology.
Earl Hergert is the vice president of marketing at Hamamatsu Corp. in Bridgewater, New Jersey. He has worked at Hamamatsu for 28 years.
Note
A version of this article was published in the December 2018 issue of Photonics Spectra.
- Confirmation
-
It looks like you're in the . If this is not your location, please select the correct region or country below.
You're headed to Hamamatsu Photonics website for US (English). If you want to view an other country's site, the optimized information will be provided by selecting options below.
In order to use this website comfortably, we use cookies. For cookie details please see our cookie policy.
- Cookie Policy
-
This website or its third-party tools use cookies, which are necessary to its functioning and required to achieve the purposes illustrated in this cookie policy. By closing the cookie warning banner, scrolling the page, clicking a link or continuing to browse otherwise, you agree to the use of cookies.
Hamamatsu uses cookies in order to enhance your experience on our website and ensure that our website functions.
You can visit this page at any time to learn more about cookies, get the most up to date information on how we use cookies and manage your cookie settings. We will not use cookies for any purpose other than the ones stated, but please note that we reserve the right to update our cookies.
1. What are cookies?
For modern websites to work according to visitor’s expectations, they need to collect certain basic information about visitors. To do this, a site will create small text files which are placed on visitor’s devices (computer or mobile) - these files are known as cookies when you access a website. Cookies are used in order to make websites function and work efficiently. Cookies are uniquely assigned to each visitor and can only be read by a web server in the domain that issued the cookie to the visitor. Cookies cannot be used to run programs or deliver viruses to a visitor’s device.
Cookies do various jobs which make the visitor’s experience of the internet much smoother and more interactive. For instance, cookies are used to remember the visitor’s preferences on sites they visit often, to remember language preference and to help navigate between pages more efficiently. Much, though not all, of the data collected is anonymous, though some of it is designed to detect browsing patterns and approximate geographical location to improve the visitor experience.
Certain type of cookies may require the data subject’s consent before storing them on the computer.
2. What are the different types of cookies?
This website uses two types of cookies:
- First party cookies. For our website, the first party cookies are controlled and maintained by Hamamatsu. No other parties have access to these cookies.
- Third party cookies. These cookies are implemented by organizations outside Hamamatsu. We do not have access to the data in these cookies, but we use these cookies to improve the overall website experience.
3. How do we use cookies?
This website uses cookies for following purposes:
- Certain cookies are necessary for our website to function. These are strictly necessary cookies and are required to enable website access, support navigation or provide relevant content. These cookies direct you to the correct region or country, and support security and ecommerce. Strictly necessary cookies also enforce your privacy preferences. Without these strictly necessary cookies, much of our website will not function.
- Analytics cookies are used to track website usage. This data enables us to improve our website usability, performance and website administration. In our analytics cookies, we do not store any personal identifying information.
- Functionality cookies. These are used to recognize you when you return to our website. This enables us to personalize our content for you, greet you by name and remember your preferences (for example, your choice of language or region).
- These cookies record your visit to our website, the pages you have visited and the links you have followed. We will use this information to make our website and the advertising displayed on it more relevant to your interests. We may also share this information with third parties for this purpose.
Cookies help us help you. Through the use of cookies, we learn what is important to our visitors and we develop and enhance website content and functionality to support your experience. Much of our website can be accessed if cookies are disabled, however certain website functions may not work. And, we believe your current and future visits will be enhanced if cookies are enabled.
4. Which cookies do we use?
There are two ways to manage cookie preferences.
- You can set your cookie preferences on your device or in your browser.
- You can set your cookie preferences at the website level.
If you don’t want to receive cookies, you can modify your browser so that it notifies you when cookies are sent to it or you can refuse cookies altogether. You can also delete cookies that have already been set.
If you wish to restrict or block web browser cookies which are set on your device then you can do this through your browser settings; the Help function within your browser should tell you how. Alternatively, you may wish to visit www.aboutcookies.org, which contains comprehensive information on how to do this on a wide variety of desktop browsers.
5. What are Internet tags and how do we use them with cookies?
Occasionally, we may use internet tags (also known as action tags, single-pixel GIFs, clear GIFs, invisible GIFs and 1-by-1 GIFs) at this site and may deploy these tags/cookies through a third-party advertising partner or a web analytical service partner which may be located and store the respective information (including your IP-address) in a foreign country. These tags/cookies are placed on both online advertisements that bring users to this site and on different pages of this site. We use this technology to measure the visitors' responses to our sites and the effectiveness of our advertising campaigns (including how many times a page is opened and which information is consulted) as well as to evaluate your use of this website. The third-party partner or the web analytical service partner may be able to collect data about visitors to our and other sites because of these internet tags/cookies, may compose reports regarding the website’s activity for us and may provide further services which are related to the use of the website and the internet. They may provide such information to other parties if there is a legal requirement that they do so, or if they hire the other parties to process information on their behalf.
If you would like more information about web tags and cookies associated with on-line advertising or to opt-out of third-party collection of this information, please visit the Network Advertising Initiative website http://www.networkadvertising.org.
6. Analytics and Advertisement Cookies
We use third-party cookies (such as Google Analytics) to track visitors on our website, to get reports about how visitors use the website and to inform, optimize and serve ads based on someone's past visits to our website.
You may opt-out of Google Analytics cookies by the websites provided by Google:
https://tools.google.com/dlpage/gaoptout?hl=en
As provided in this Privacy Policy (Article 5), you can learn more about opt-out cookies by the website provided by Network Advertising Initiative:
http://www.networkadvertising.org
We inform you that in such case you will not be able to wholly use all functions of our website.
Close