![]()
Products


We are actively taking measures to improve product quality levels.
Applications


Why Hamamatsu?
Resources


Support


Our company


Investors


United Kingdom (EN)
Select your region or country.
Empowering Innovation: Unlocking Opportunities with Smaller and Ultra-high Dynamic Range Spectrometers
Advanced instrumentation to address today’s challenges
INTRODUCTION
Spectroscopy is one of the most commonly utilized techniques for solving a myriad of technical issues. From community-focused uses, such as precision agriculture and environmental monitoring, to the design and production of advanced materials, spectroscopy’s wide applicability helps improve lives around the world. However, there are pressing challenges in the industry which must be resolved to meet the growing analytical needs of today.
There is increasing demand for miniaturized spectrometers that enable real-time analysis at the specific location where rapid answers are needed. Improved illumination techniques for Attenuated Total Reflectance (ATR) measurements are also essential for enhancing the accuracy and integrity of the data. In addition, the importance of ultra-high dynamic range spectrometers for providing the reliable acquisition of both weak and high intensity signals in one measurement is escalating. Hamamatsu offers solutions to these vital needs so that spectroscopy may advance important fields of science now and be well prepared for the future.

Gaetano Panagia
Technical Marketing Engineer at Hamamatsu Photonics Europe

Dr. Frank Tobias
Leader Technical Marketing Engineers Europe at Hamamatsu Photonics Europe
MINIATURIZED SPECTROSCOPY
By 2100, Earth’s population is expected to increase by 40 % to approximately 11 billion people. This growth poses significant pressures for providing sufficient nourishment to the populace and avoiding world hunger. To address this critical issue, there are new solutions for the challenges of food and water quality monitoring.
Spectroscopy for Agriculture
In 2021, 11 % of the world population was undernourished, and that number has continued to rise. With population growth challenging the food supply, the importance of spectroscopy for supporting agriculture is intensifying. There are several contributions of spectroscopy to this issue which cover the entire supply chain. For example, it can be used to assess the quality of soil to determine which crops are best for planting in a specific plot of land. Irrigation can be refined in order to improve the yield of crops and save water. In addition, the quantity of fertilizer may be optimized to reduce waste as well as pollution. Spectroscopy can also determine the best period for harvesting specific produce and empower automatic harvesting using robots. After the crops enter the transportation chain, spectroscopy can sort food according to its best use, such as deciding if an apple should go on the shelf of a supermarket or be used to produce juice or jam. Spectroscopy detects the adulteration of food so that consumers have the best quality products on their table. Although their use is already widespread, the global market for spectrometers in agriculture is expected to grow by 8 % for benchtop instruments and 19 % for handheld units each year up to 2027.[1]
As spectrometer technology advances, the dimensions of the instruments decrease, enabling new possibilities. Large instruments may provide important information, but their size limits their use to laboratory settings. This requires sample collection and submittal, then waiting for results, thereby making the sampling to decision time take days to weeks. Somewhat smaller on-site instrumentation can shorten that timeline to hours, and even smaller units can be integrated into large machinery such as a sorting machine or a tractor for rapid soil analysis. Very small handheld and mobile-based devices accelerate the decision time to just seconds as they provide answers in real time.
These spectrometers are dispersive based, so that the light coming from the sample, which can be transmitted through or reflected by the sample, travels through a grating that separates it into its wavelength components. Each of these components is then focused on a pixel in a linear sensor, as shown on the left side of FIGURE 1. These types of devices are extremely widespread in the industry, but they suffer from a tradeoff between the light throughput and the optical resolution. This means that users must choose between acquiring a very high signal-to-noise ratio (SNR) or good resolution.
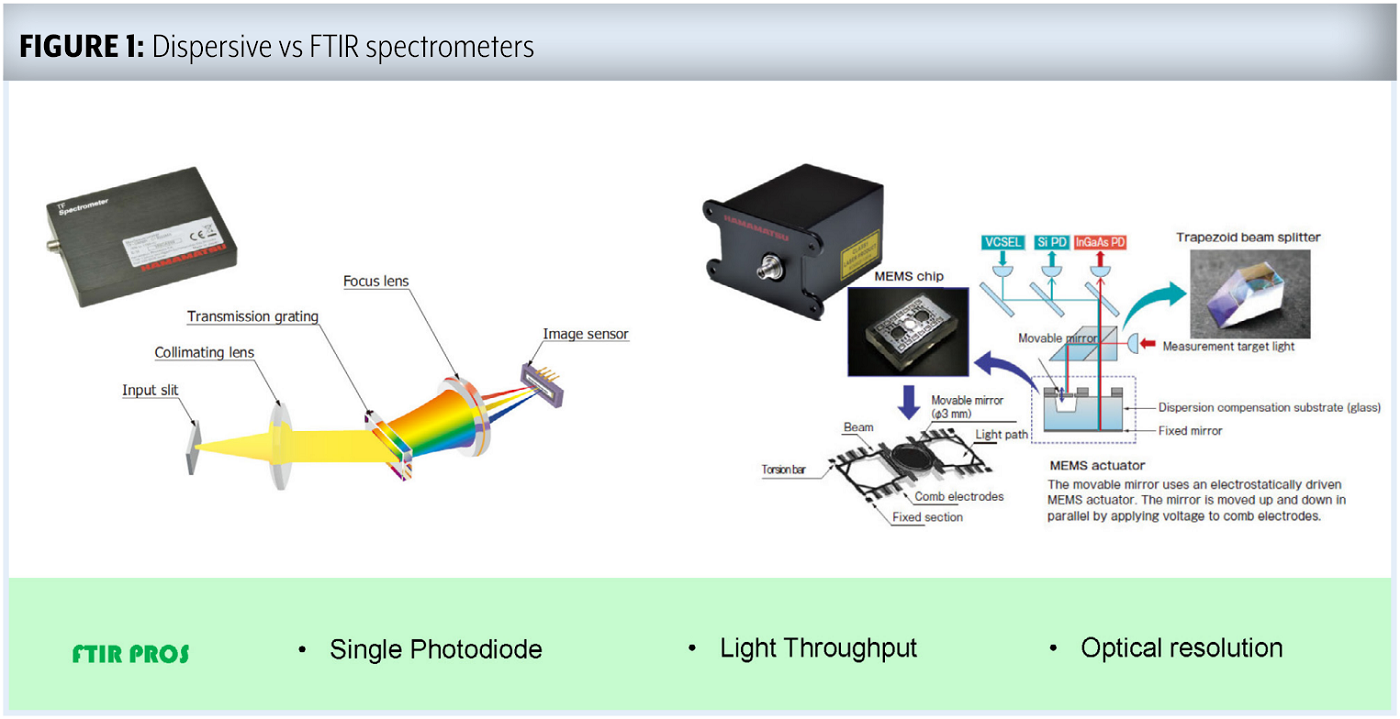
In contrast, a Fourier Transform Infrared Spectrometer (FTIR), depicted on the right side of the figure, works differently. The light that comes from the sample is split into two different paths. One path goes to a fixed mirror and the other one goes to a microelectromechanical systems (MEMS) movable mirror. When these two paths recombine, they create an interferogram that can be analyzed with FT algorithms to produce a spectrum of the sample. In this case, there is no tradeoff between light throughput and optical resolution, so the measurement can have high SNR and optical resolution. Moreover, FTIR devices work with a single photodiode instead of a linear sensor, which makes them simpler and more cost effective.
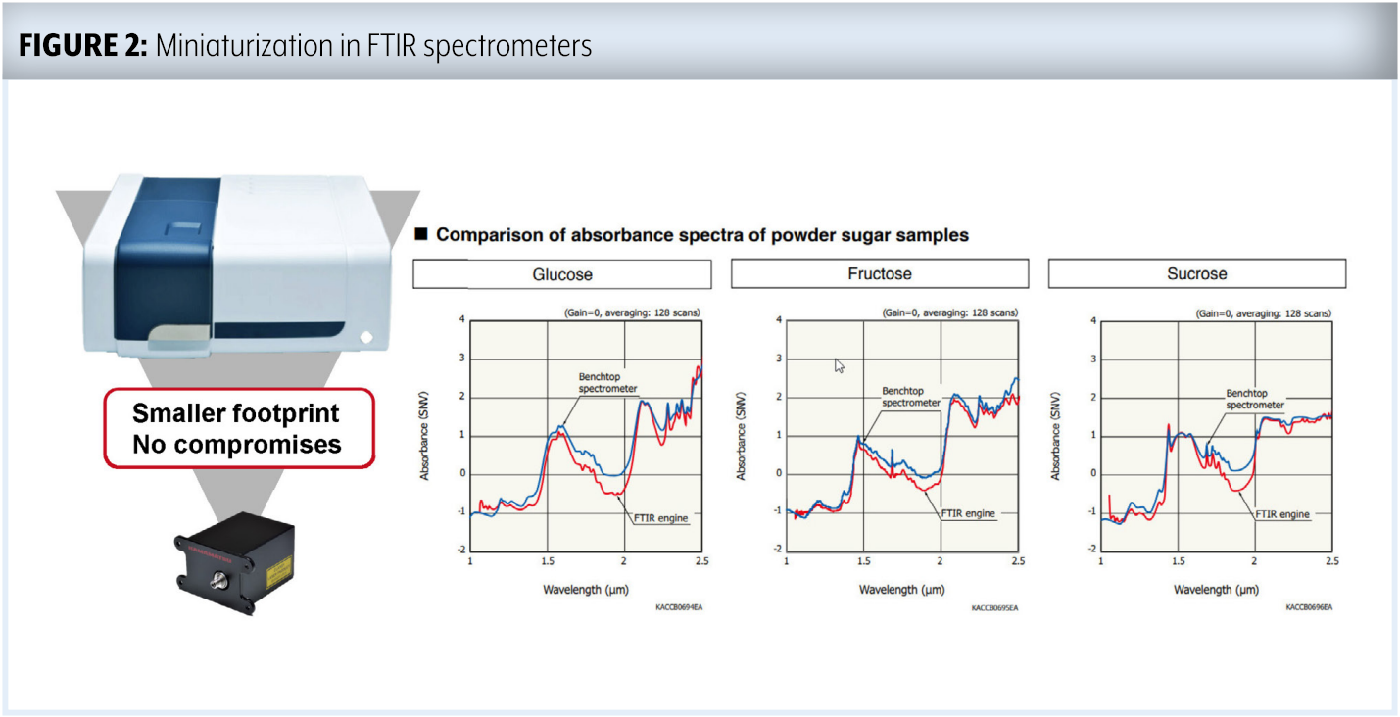
Hamamatsu offers a handheld FTIR spectrometer that fits in the palm of the hand and has proven to be well-suited to agricultural applications. A comparison of spectra from this device to those from a benchtop spectrometer is illustrated in FIGURE 2. The graphs demonstrate that the absorbance peaks of glucose, fructose, and sucrose produced by the two instruments are extremely comparable. Even the absorbance signal strengths are very similar. Thus, a device with a smaller footprint can be utilized without compromising on the technical specifications of the spectrometer.
When applied to agriculture, one of spectroscopy’s biggest challenges is to make it widely adopted in the market. This is because these instruments are very often used by non-technical and untrained operators. Chemometrics, however, can solve this issue and increase adoption. Chemometrics is a set of algorithms that can translate the spectral measurements into physical and chemical properties of the sample, which helps the user make decisions on their sample.
Another challenge is sample presentation. In agriculture, there is a multitude of samples coming in all different forms, such as fruits, powder, seeds, or liquid. Each one of these samples requires different handling in order to produce repeatable and reliable results. Users must find the best sample presentation technique for each specific application.
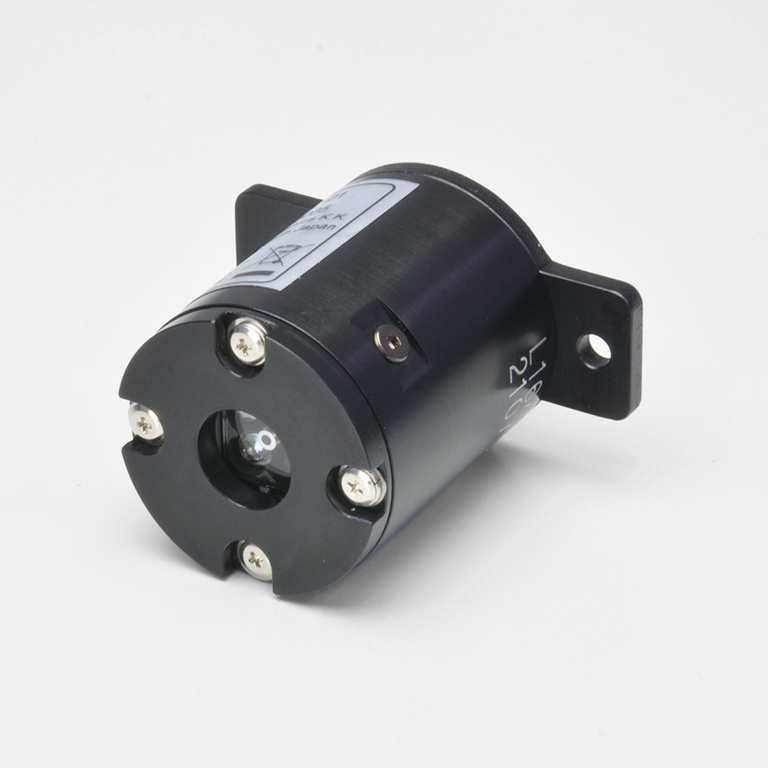
There is also an issue of signal-to-noise ratio, especially when the application uses reflected light. In some instances, the signal may be faint compared to the background, so instruments capable of high SNR are necessary for sufficient detection. For this reason, Hamamatsu recently developed a unique lamp specifically to improve the SNR in diffuse reflection measurements by improving light emission. The lamp, which is actually composed of four halogen lamps, is arranged in a way in which their emitted light gets reflected by the sample and then directed into the optical fiber for introduction into the spectrometer. Its small size of 28 mm × 35.5 mm belies its capabilities for improving the signal-to-noise ratio. The light is a near infrared (NIR) emission between 1100 nm and 2500 nm which is perfectly suited to agricultural applications. Conveniently, this lamp is compatible with Hamamatsu’s FTIR Engine as well as any spectrometer that is capable of processing near infrared wavelengths.
Spectroscopy for Water Quality
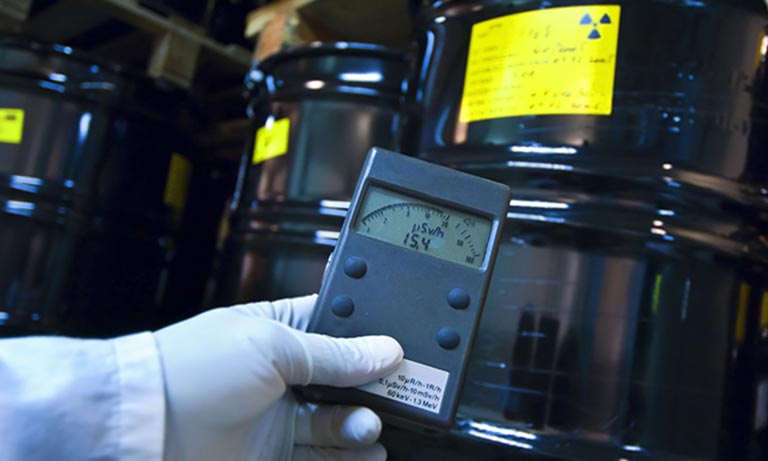
Worldwide, approximately 3.4 million people die every year due to water borne disease. Moreover, 80 % of industrial wastewater is released into the environment without proper treatment. Fortunately, spectroscopy can be used to assess wastewater for the presence of pollutants and monitor the quality of drinking water. While agricultural applications generally utilize wavelengths in the NIR range, ultraviolet (UV) wavelengths are typically used for water analysis.
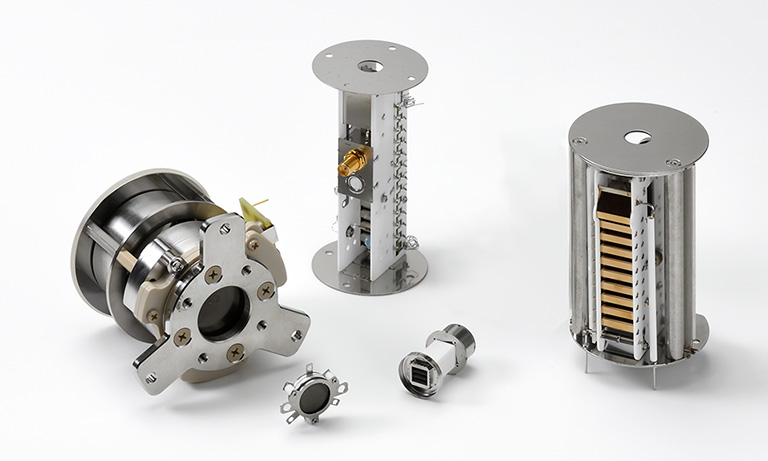
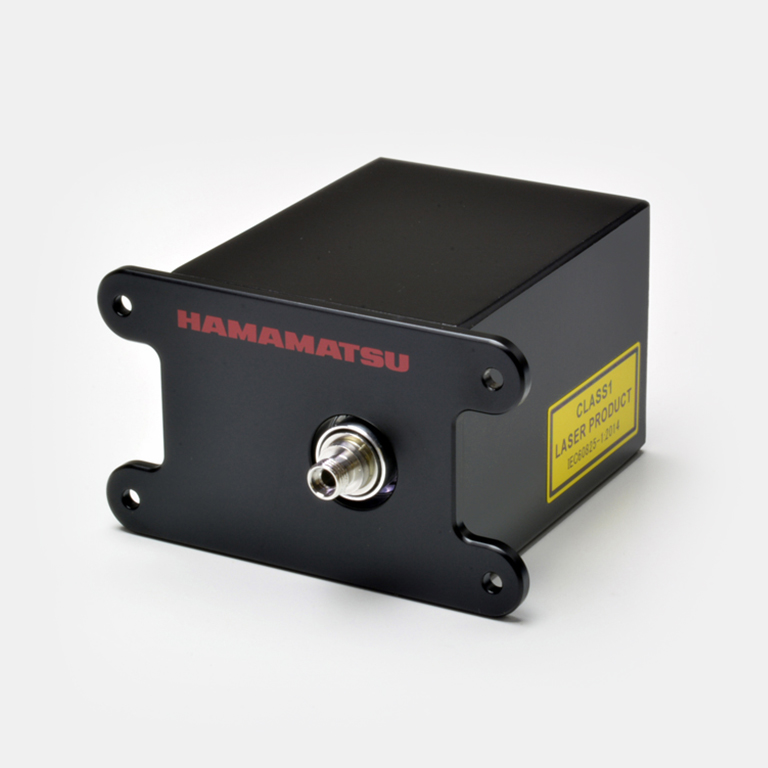
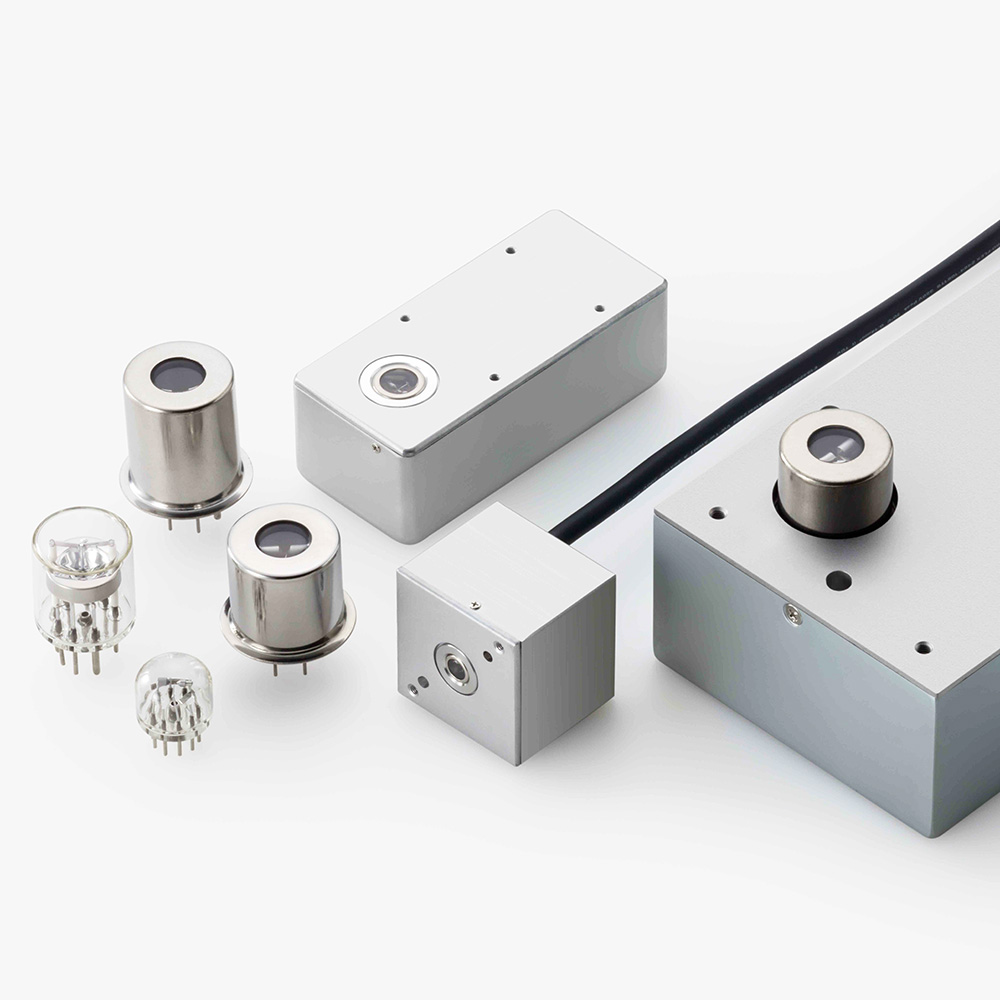
Hamamatsu has introduced a miniaturized spectrometer for water analysis that delivers real-time measurements to allow quick responses to crises, such as catastrophic events that pollute a water body. The spectrometer can measure multiple parameters simultaneously, including color, nitrate, Spectral Absorption Coefficient SAC254, Total Oxygen Content (TOC), and Depleted Oxygen Content (DOC). The measurement requires a high-precision light source; Hamamatsu is a world leader in the production of xenon flash lamps which have a wavelength range fully compatible with UV spectroscopy. The lamps are available in several different packaging options with several different output powers.
The new miniaturized spectrometer is totally compatible with water quality monitoring applications, having a spectral response range between 190 nm and 400 nm, very good spectral resolution at 2 nm, signal-to-noise ratio of 20,000 and a very good dynamic range of 180,000 to 1. At only 23 mm × 32 mm × 40 mm, the spectrometer can be readily deployed in wastewater treatment facilities or even directly into water pipes.
SPECTROSCOPY AT ULTRA-HIGH DYNAMIC RANGE
After light from a sample is separated into its different wavelength ranges by a grating, it is then detected by a point detector in scanning mode through a slit. Alternatively, the complete spectrum can be detected at once with an image sensor such as a Charge Coupled Device (CCD) camera that detects photons. Lenses that collimate and focus the light, in addition to other components, must be carefully designed to create a spectrometer with optimal performance. Some key characteristics that must be considered include spectral range and resolution, wavelength accuracy, repetition frequency, signal-to-noise ratio, dynamic range (DR), and F number. Spectral range is the breadth of the spectrum that can be detected with the spectrometer. How well the wavelengths can be resolved, how accurately the wavelengths can be measured, and how rapidly they are measured are also important. SNR mainly defines the sensitivity, while the dynamic range determines the highest and lowest signals that can be detected in one measurement with the device. The F number represents the light collection efficiency. All of these attributes significantly affect the quality of a spectrometer’s output.
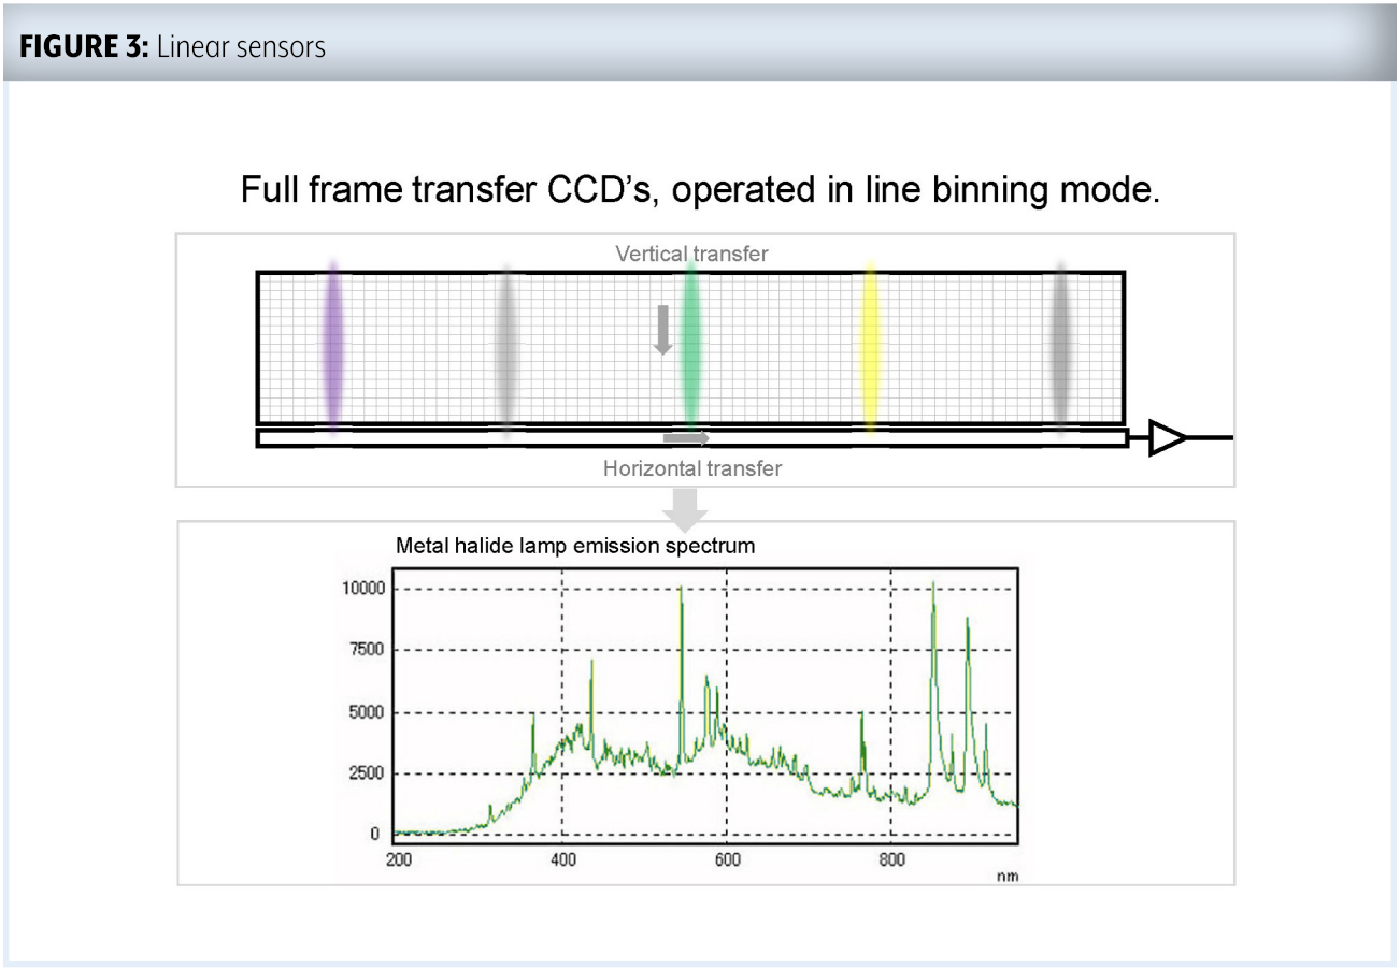
For spectrometers that employ a CCD image sensor, each wavelength is imaged and then the CCD image sensor is typically read out with vertical binning. As shown in FIGURE 3, all of the vertical pixels are transferred to the horizontal transfer which is then read electronically. The intensity counts over the horizontal pixels or, in other words, over the spectral range, then create the spectrum. Unfortunately, this method has some limitations. High intensity peaks can saturate the horizontal transfer and can no longer be quantified; thus, the measurement is limited by the full-well capacity of the horizontal register. Weak signals may also get buried in the noise. Increasing the full well capacity also increases the noise level so that analysts must choose to focus on either high or low-intensity signals. Ideally, a spectrometer should be capable of accurately detecting very high and very low intensity counts in the same measurement.
After light from a sample is separated into its different wavelength ranges by a grating, it is then detected by a point detector in scanning mode through a slit. Alternatively, the complete spectrum can be detected at once with an image sensor such as a Charge Coupled Device (CCD) camera that detects photons. Lenses that collimate and focus the light, in addition to other components, must be carefully designed to create a spectrometer with optimal performance. Some key characteristics that must be considered include spectral range and resolution, wavelength accuracy, repetition frequency, signal-to-noise ratio, dynamic range (DR), and F number. Spectral range is the breadth of the spectrum that can be detected with the spectrometer. How well the wavelengths can be resolved, how accurately the wavelengths can be measured, and how rapidly they are measured are also important. SNR mainly defines the sensitivity, while the dynamic range determines the highest and lowest signals that can be detected in one measurement with the device. The F number represents the light collection efficiency. All of these attributes significantly affect the quality of a spectrometer’s output.
For spectrometers that employ a CCD image sensor, each wavelength is imaged and then the CCD image sensor is typically read out with vertical binning. As shown in FIGURE 3, all of the vertical pixels are transferred to the horizontal transfer which is then read electronically. The intensity counts over the horizontal pixels or, in other words, over the spectral range, then create the spectrum. Unfortunately, this method has some limitations. High intensity peaks can saturate the horizontal transfer and can no longer be quantified; thus, the measurement is limited by the full-well capacity of the horizontal register. Weak signals may also get buried in the noise. Increasing the full well capacity also increases the noise level so that analysts must choose to focus on either high or low-intensity signals. Ideally, a spectrometer should be capable of accurately detecting very high and very low intensity counts in the same measurement.
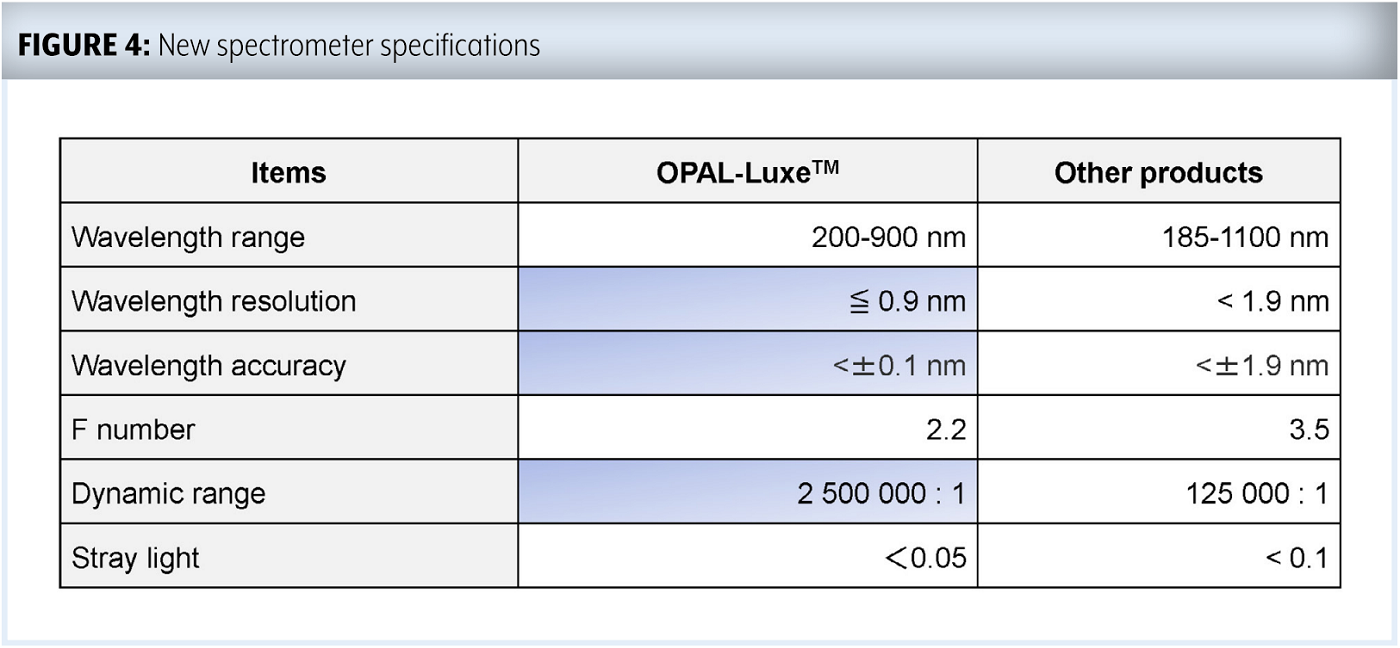
To meet this challenge, a new spectrometer has been developed by Hamamatsu that measures over an extremely high dynamic range with excellent signal-to-noise. The compact OPAL-Luxe® instrument uses an optical fiber to introduce the light into the spectrometer. In addition to an impressive dynamic range of 2,500,000:1, it offers high sensitivity, wide spectral range, high wavelength resolution, and minimal stray light. Specifications for the instrument and a comparison to other top spectrometers on the market are tabulated in FIGURE 4. The superior qualities of the OPAL-Luxe® spectrometer enable outstanding performance, leading to better decision making for improved outcomes.
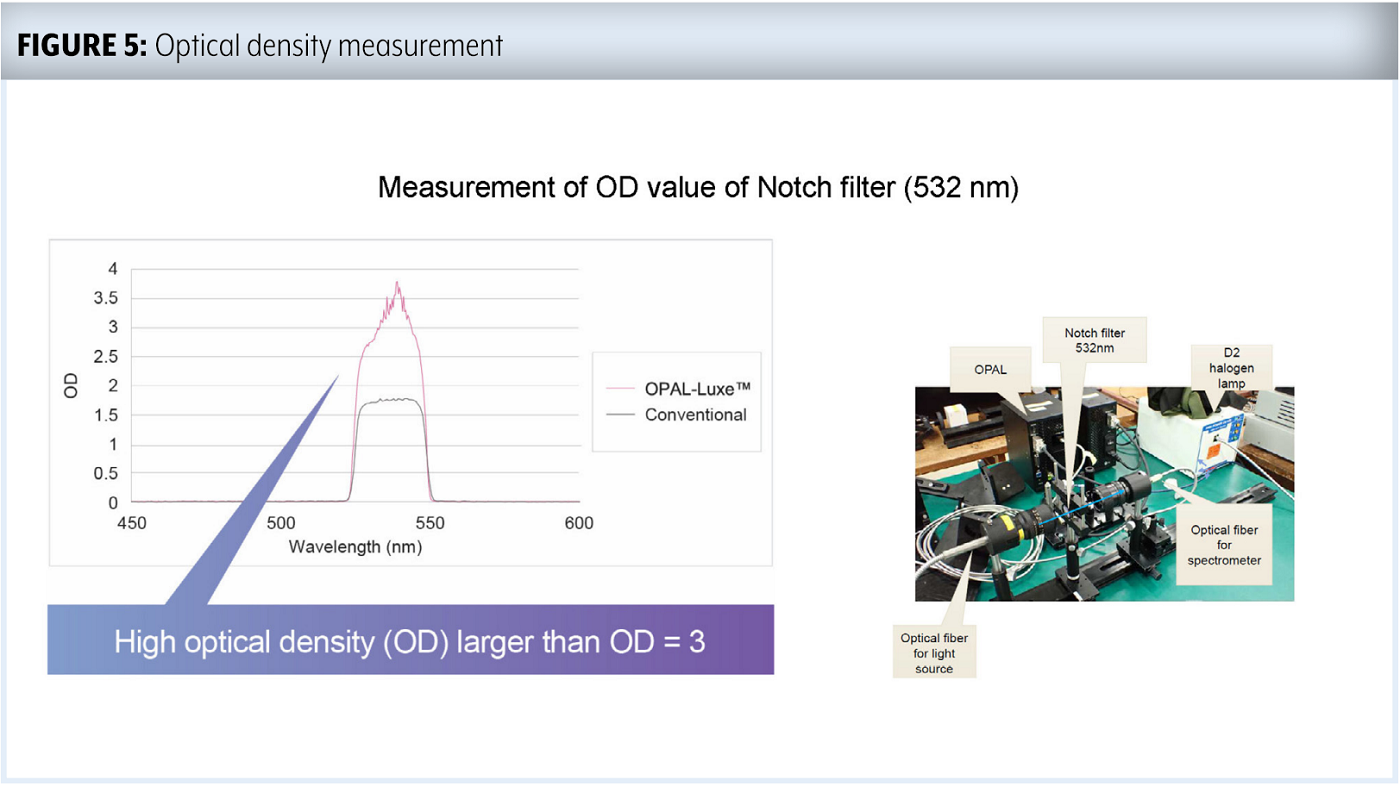
The new instrument’s ultra-high dynamic range facilitates high optical density measurements. FIGURE 5 demonstrates the optical density (OD) measurement of the notch filter at 532 nm compared to a conventional spectrometer. While most CCD image sensor-based spectrometers can perhaps detect OD up to 2, the OPAL-Luxe® can detect optical densities higher than 3, which directly illustrates the high dynamic range performance of the new spectrometer. The power of the high DR can benefit other applications as well, for example the accurate measurement of absorption in high density solutions that also contain trace substances.
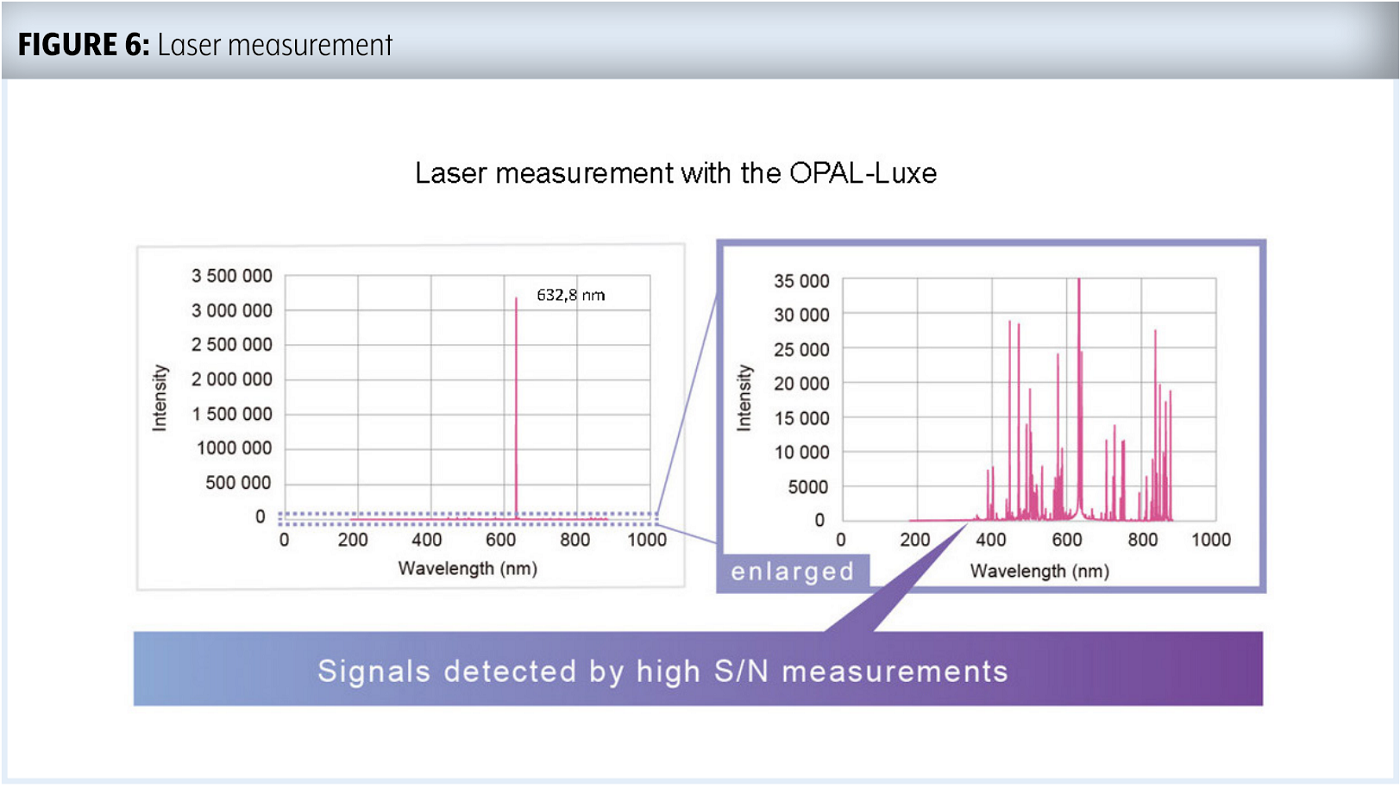
In laser measurements, typical spectrometers become saturated by the intensity of the laser light, thereby inhibiting the dynamic range of the instrument unless the laser light is attenuated. FIGURE 6 shows an example of a helium neon laser measurement with the OPAL-Luxe® . The high intensity signal from the laser at 632.8 nm would prevent the detection of weak signals with a different instrument, yet zooming in on the baseline shows that the OPAL-Luxe® resolved both very high and very low intensity peaks in the same measurement. This capability enables the new spectrometer to outperform other instruments, making the OPAL-Luxe® the most suitable instrument for plasma emission measurements
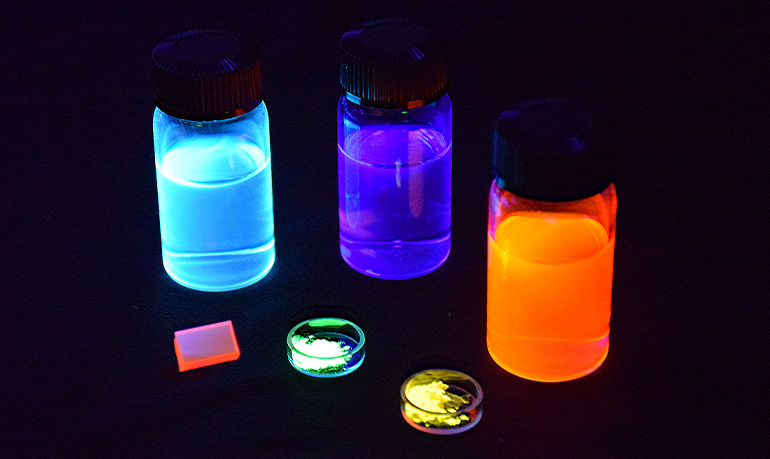
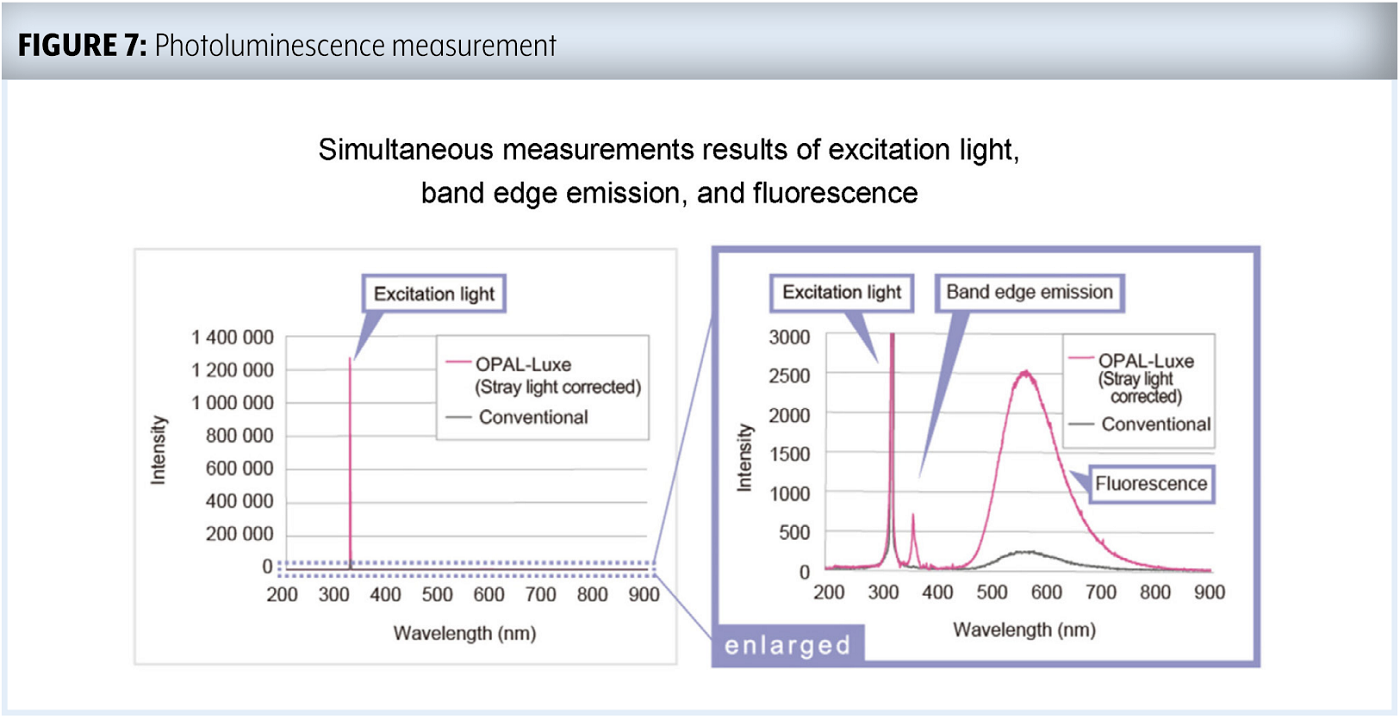
In an application for photoluminescence measurements, gallium nitride (GaN) was excited at 325 nm with high intensity excitation light. Shown in FIGURE 7, the high and low intensity signals were accurately detected simultaneously. In addition, the band emission and fluorescence of the GaN were also detected in that measurement. Using other spectrometers, optical filters would be necessary to filter out the excitation light and then measure the fluorescence signal. Yet, the OPAL-Luxe® provided detection of both excitation light and fluorescence at the same time.
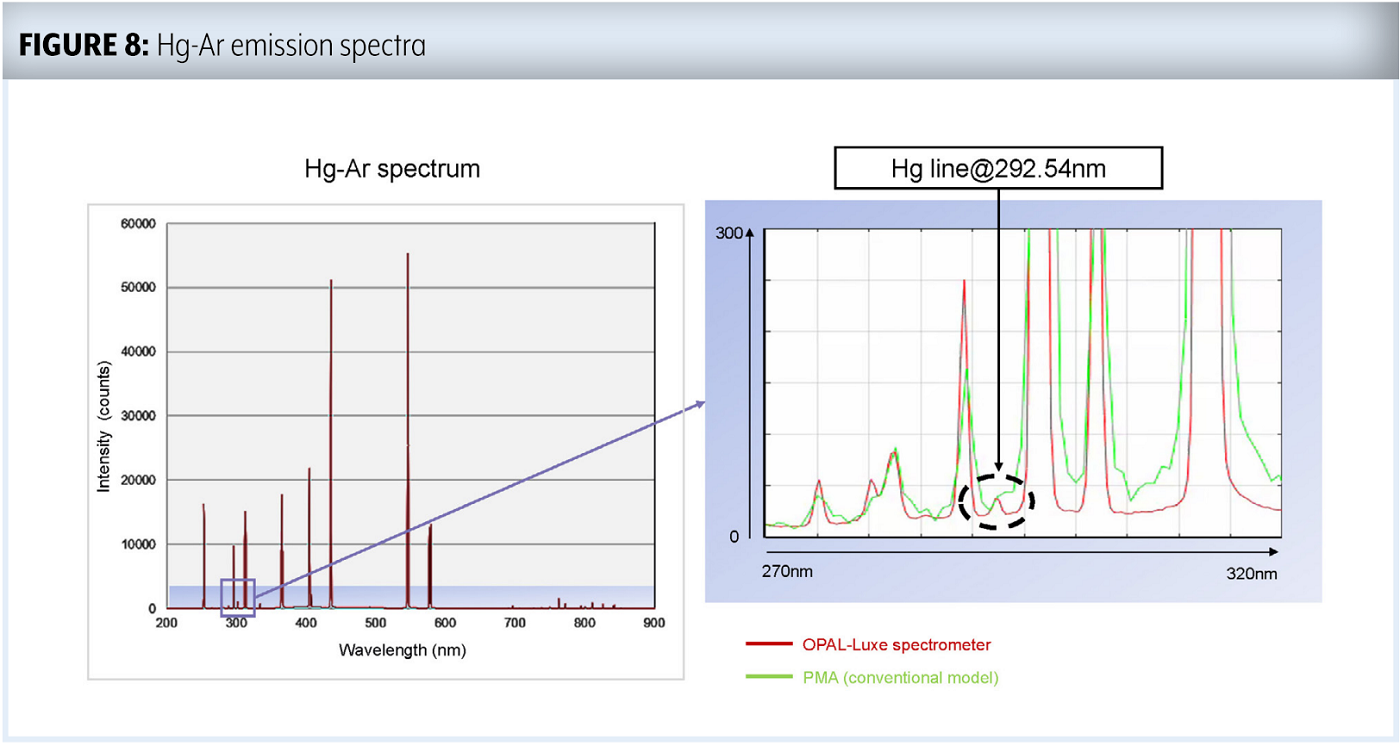
The most impressive example of the new spectrometer’s performance is the measurement of a mercury-argon emission spectrum shown in FIGURE 8. High intensity signals of the gas emission were detected concurrently with very small intensity emissions of mercury at 292 nm. Good SNR and stability were observed despite the range of signal counts from approximately 55,000 for the major peaks down to roughly 30 counts for the mercury. This demonstrates the remarkable dynamic range and sensitivity of the OPAL-Luxe® instrument.
CONCLUSION
The ever-changing world demands innovations in analytical instrumentation. Miniaturized spectrometers have been providing answers relating to world hunger and advanced materials that improve lives around the globe, and their importance will increase in the years to come. The development of cutting-edge spectrometers, light sources, and other technologies have expanded the understanding of complex issues in numerous fields of science. Leading the way is Hamamatsu, which is committed to the industry, providing the most advanced and reliable photonics technologies to their partners. They are equally committed to the people of the world by enabling technologies that improve the quality of life by, for example, monitoring water quality or contributing to a better food supply chain. They are also committed to the planet, empowering technologies that have great potential to reduce the amount of waste and pollution on earth.
References
[1] Photonic Technologies for Agriculture, Messe Munchen, Tematys and Spectraris, February 2023
- Confirmation
-
It looks like you're in the . If this is not your location, please select the correct region or country below.
You're headed to Hamamatsu Photonics website for GB (English). If you want to view an other country's site, the optimized information will be provided by selecting options below.
In order to use this website comfortably, we use cookies. For cookie details please see our cookie policy.
- Cookie Policy
-
This website or its third-party tools use cookies, which are necessary to its functioning and required to achieve the purposes illustrated in this cookie policy. By closing the cookie warning banner, scrolling the page, clicking a link or continuing to browse otherwise, you agree to the use of cookies.
Hamamatsu uses cookies in order to enhance your experience on our website and ensure that our website functions.
You can visit this page at any time to learn more about cookies, get the most up to date information on how we use cookies and manage your cookie settings. We will not use cookies for any purpose other than the ones stated, but please note that we reserve the right to update our cookies.
1. What are cookies?
For modern websites to work according to visitor’s expectations, they need to collect certain basic information about visitors. To do this, a site will create small text files which are placed on visitor’s devices (computer or mobile) - these files are known as cookies when you access a website. Cookies are used in order to make websites function and work efficiently. Cookies are uniquely assigned to each visitor and can only be read by a web server in the domain that issued the cookie to the visitor. Cookies cannot be used to run programs or deliver viruses to a visitor’s device.
Cookies do various jobs which make the visitor’s experience of the internet much smoother and more interactive. For instance, cookies are used to remember the visitor’s preferences on sites they visit often, to remember language preference and to help navigate between pages more efficiently. Much, though not all, of the data collected is anonymous, though some of it is designed to detect browsing patterns and approximate geographical location to improve the visitor experience.
Certain type of cookies may require the data subject’s consent before storing them on the computer.
2. What are the different types of cookies?
This website uses two types of cookies:
- First party cookies. For our website, the first party cookies are controlled and maintained by Hamamatsu. No other parties have access to these cookies.
- Third party cookies. These cookies are implemented by organizations outside Hamamatsu. We do not have access to the data in these cookies, but we use these cookies to improve the overall website experience.
3. How do we use cookies?
This website uses cookies for following purposes:
- Certain cookies are necessary for our website to function. These are strictly necessary cookies and are required to enable website access, support navigation or provide relevant content. These cookies direct you to the correct region or country, and support security and ecommerce. Strictly necessary cookies also enforce your privacy preferences. Without these strictly necessary cookies, much of our website will not function.
- Analytics cookies are used to track website usage. This data enables us to improve our website usability, performance and website administration. In our analytics cookies, we do not store any personal identifying information.
- Functionality cookies. These are used to recognize you when you return to our website. This enables us to personalize our content for you, greet you by name and remember your preferences (for example, your choice of language or region).
- These cookies record your visit to our website, the pages you have visited and the links you have followed. We will use this information to make our website and the advertising displayed on it more relevant to your interests. We may also share this information with third parties for this purpose.
Cookies help us help you. Through the use of cookies, we learn what is important to our visitors and we develop and enhance website content and functionality to support your experience. Much of our website can be accessed if cookies are disabled, however certain website functions may not work. And, we believe your current and future visits will be enhanced if cookies are enabled.
4. Which cookies do we use?
There are two ways to manage cookie preferences.
- You can set your cookie preferences on your device or in your browser.
- You can set your cookie preferences at the website level.
If you don’t want to receive cookies, you can modify your browser so that it notifies you when cookies are sent to it or you can refuse cookies altogether. You can also delete cookies that have already been set.
If you wish to restrict or block web browser cookies which are set on your device then you can do this through your browser settings; the Help function within your browser should tell you how. Alternatively, you may wish to visit www.aboutcookies.org, which contains comprehensive information on how to do this on a wide variety of desktop browsers.
5. What are Internet tags and how do we use them with cookies?
Occasionally, we may use internet tags (also known as action tags, single-pixel GIFs, clear GIFs, invisible GIFs and 1-by-1 GIFs) at this site and may deploy these tags/cookies through a third-party advertising partner or a web analytical service partner which may be located and store the respective information (including your IP-address) in a foreign country. These tags/cookies are placed on both online advertisements that bring users to this site and on different pages of this site. We use this technology to measure the visitors' responses to our sites and the effectiveness of our advertising campaigns (including how many times a page is opened and which information is consulted) as well as to evaluate your use of this website. The third-party partner or the web analytical service partner may be able to collect data about visitors to our and other sites because of these internet tags/cookies, may compose reports regarding the website’s activity for us and may provide further services which are related to the use of the website and the internet. They may provide such information to other parties if there is a legal requirement that they do so, or if they hire the other parties to process information on their behalf.
If you would like more information about web tags and cookies associated with on-line advertising or to opt-out of third-party collection of this information, please visit the Network Advertising Initiative website http://www.networkadvertising.org.
6. Analytics and Advertisement Cookies
We use third-party cookies (such as Google Analytics) to track visitors on our website, to get reports about how visitors use the website and to inform, optimize and serve ads based on someone's past visits to our website.
You may opt-out of Google Analytics cookies by the websites provided by Google:
https://tools.google.com/dlpage/gaoptout?hl=en
As provided in this Privacy Policy (Article 5), you can learn more about opt-out cookies by the website provided by Network Advertising Initiative:
http://www.networkadvertising.org
We inform you that in such case you will not be able to wholly use all functions of our website.
Close