
Products










We are actively taking measures to improve product quality levels.
Applications














Why Hamamatsu?
Resources





Support



Our company







Investors







United Kingdom (EN)
Select your region or country.


How Advanced Sensing is Transforming Agriculture
Precision agriculture demands faster, nondestructive insight into soil, water, and crop health. Miniaturized and inline spectroscopic technologies are supporting these needs by enabling laboratory-grade analysis in the field.
Introduction
Agriculture is turning to optical sensing to make faster, better-informed decisions. This shift is described as smart agriculture, digital farming, or agri-photonics. At the center of these applications is spectroscopy, which is the analysis of how materials absorb and reflect light at different wavelengths to reveal properties invisible to the eye.

Gaetano Panagia, Technology and Market Expert
Spectroscopy In Agriculture
Spectroscopy serves two broad purposes in agriculture: characterizing the external color of a product and determining its internal composition. When broadband light is directed at a sample such as an apple, part of the light is absorbed and part of it is reflected. Analyzing the reflected light, particularly in the near-infrared (NIR) spectrum, can distinguish among apple varieties such as Golden Delicious, Granny Smith, and Star King Delicious, revealing compositional details that appearance alone cannot. This paper traces several spectroscopic principles, the agricultural applications they enable, and the development pathways that can help translate photonic sensing technologies into practical agricultural solutions.
Grating-Based Spectrometers
The most widespread spectroscopic approach uses grating-based instruments. Light reflected from the sample enters the instrument through a slit, is collimated, and reaches a grating that separates broadband light into its individual wavelengths. Each wavelength is then focused onto a distinct pixel of a linear image sensor, allowing the intensity at every wavelength to be measured.
The value of this approach in digital farming depends on the wavelength range under investigation. In the ultraviolet (UV) range, between roughly 200 nm and 400 nm, analysis can detect water pollutants including nitrates and nitrites, supporting environmental monitoring and regulatory compliance. In the visible and NIR range, roughly 350 nm to 850 nm, silicon sensors can detect chlorophyll absorption, which is a strong indicator of crop health. A compact spectrometer mounted on a drone can survey a field and flag areas needing attention by reading the visible spectrum. In the shortwave infrared (SWIR), from about 800 nm to 2,500 nm, lies perhaps the most crucial range for digital farming. Remote soil analysis of moisture levels and fertilizer needs support yield optimization while limiting the waste of water and other resources.
Hamamatsu Photonics' grating-based portfolio includes instruments for different integration and analysis requirements. One example is a fingertip-sized spectrometer whose longest dimension is 20 mm, integrating a silicon sensor sensitive from 190 nm up to 1,000 nm depending on the model. Its compact form factor is enabled by a proprietary CMOS process that etches the input slit directly onto the linear image sensor. This analog device can be free-space based or fitted with an SMA connector for fiber coupling, giving integrators flexibility in optical and mechanical design. At the module level is a plug-and-play mini-spectrometer module offering USB or Ethernet connectivity, fiber input, and higher sensitivity and resolution. It is available in cooled and uncooled versions across ranges from UV to SWIR.
Solving the Value Problem with Shortwave Infrared
The importance of composition over appearance becomes clear in two scenarios. Consider two neighboring farmers growing the same crop, one harvesting early and one late. If both are paid by weight, the farmer selling drier, later-season produce is valued less despite delivering greater nutritional value due to a lower water content and therefore lower weight than the early-harvest produce. As the weight reflects water content as well as dry matter, sugar, starch, or fiber, the other farmer will be paid more, but not necessarily because of a higher-value crop. Similarly, an animal farmer wants full control over the nutritional values of feed and assurance that its advertised characteristics hold true. Both problems point toward the same tool: a SWIR mini spectrometer.
Sharing the compact form of the aforementioned silicon device, it uses an indium gallium arsenide (InGaAs) detector sensitive from 850 nm to 1,700 nm—the fingerprint region where absorption features of sugar, protein, starch, and water appear. At 20 mm with a spectral resolution near 15 nm, it integrates temperature measurement for reliable readings as conditions change and offers free-space or fiber configurations with an electronic shutter. Extending analysis from a single point to many pixels enables imaging, widely used to sort foreign objects from food. Stones that are difficult to distinguish among coffee beans by eye appear as dark spots under SWIR and can be identified thousands of times per second as product falls or moves along a conveyor. The same imaging can reveal bruises in fruit invisible under normal light, supporting quality-based sorting.
Fourier Transform Spectroscopy
Fourier transform spectroscopy (FTS) routes reflects light through a beam splitter into two arms: one reflecting off a fixed mirror, the other off a movable mirror. Recombined and directed to a SWIR InGaAs detector, the beams produce an interference pattern that varies with mirror position, forming an interferogram. A fast Fourier transform then yields the absorption spectrum, in this case spanning 1,000 nm to 2,500 nm. This technique supports fingerprinting of food origin, composition, and processing history.
These are useful for fraud prevention with high-value goods such as honey, olive oil, and wine. It also supports soil analysis and food quality assessment. A dairy processor, for example, might blend milk from multiple suppliers to maintain consistent final characteristics.
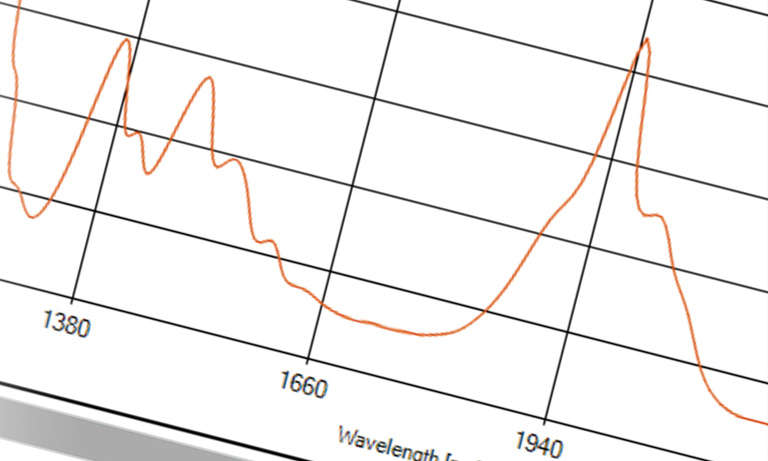
Hamamatsu's FTS instrument covers 1,100 nm to 2,500 nm, and, in its latest iteration, reaches 275 frames per second. This speed is fast enough to classify sugar from artificial sweetener, in real time, on a conveyor belt. An advantage of the approach is it avoids the issues between resolution and signal-to-noise ratio inherent to grating instruments, where narrowing the entrance slit sharpens resolution but sacrifices light.
A demonstration on almonds, cashews, and walnuts illustrated the workflow. After acquiring full absorbance spectra, a discriminating spectral window was isolated, a second derivative applied, and principal component analysis used to classify the samples, which cleanly separated. Repeating the test on powdered nuts produced even clearer separation, as grinding yields a more homogeneous sample.
The Fabry-Pérot Interferometer (MEMS-FPI)
A third instrument, the Fabry-Pérot interferometer, uses two mirrors. One is fixed at the bottom and one adjustable by applied voltage to form a variable filter that sweeps the air gap between them before light reaches an InGaAs detector. This principle was applied to distinguish wheat, rice, and buckwheat flours. The resulting handheld analyzer integrates its own light source, operates across three ranges of roughly 300 nm each covering 1,350 nm to 2,150 nm, and is USB powered and controlled. Its affordability suits applications such as moisture detection near 1,450 nm, sugar content, and fruit ripeness measured by Brix value, with potential in process control such as acetic fermentation monitoring. When run on the same unprocessed nuts, it again produced a valid classification despite its narrower range.
Gas Sensing in the Mid-Infrared
Beyond 3,000 nm, in the mid-infrared, spectroscopy becomes useful for gas measurements which is relevant to farming for three reasons. First, new EU regulation is expected to set maximum ammonia and methane levels in animal barns for livestock safety. Second, methane emissions from livestock, which are a significant greenhouse gas source, face monitoring requirements, and carbon trading schemes may prompt carbon dioxide (CO2) measurement.1 Lastly, with the rising cost of gas and some countries not having access to natural gases, they are turning to biogas production. Biogas produced from agricultural by-products and manure benefits from quantification.
Non-dispersive IR spectroscopy handles these measurements by passing light through a gas cell to a detector fitted with a bandpass filter, which is matched to a target gas's absorption band. When there is no gas in the chamber, a baseline signalis indicated. When CO2 enters the gas chamber, it absorbs part of the light at 4.3 μm, decreasing the detector signal. With this decrease, not only is gas identified, but it is also quantified based on the concentration of gas in the environment.
Hamamatsu offers mid-infrared detectors based on indium arsenide antimonide and optimized LEDs for gases including carbon dioxide and methane. Compared with electrochemical methods, the photonic approach offers higher sensitivity and selectivity, fast responses, and minimal maintenance; it can run for years after a single calibration, making it well suited to remote or battery-powered deployment.
Conclusion
Within agriculture, the properties that determine a product's value or risk are largely invisible to the eye. None of these properties can be judged reliably by weight, color, or appearance, yet those visible proxies have long governed how crops are priced and how quality is assessed. Grating-based spectrometers, Fourier transform instruments, the Fabry-Pérot analyzer, SWIR imaging, and mid-infrared gas sensing each convert one of these hidden properties into a measurable value. These are at a scale and cost increasingly suited to drones, conveyor lines, and handheld field devices. With science already in place, the remaining challenge is translation: matching a grower's specific problem to the appropriate photonic technique and bringing it to market at scale. To help bridge this gap, Hamamatsu has established a European Pilot Line team that supports customers from feasibility studies and specification definition through optoelectronic module design, prototyping, and industrialization. By combining Hamamatsu's expertise in light emitters and detectors with the application knowledge of customers, the Pilot Line service helps accelerate the path from product concept to mass manufacturing while reducing development risk, time, and cost.
Want to Learn More? Watch the Full Webinar.
Dive deeper into the topic and hear directly from our expert. The full webinar recording is now available to watch on demand whenever it suits you.
Related products
References
1) European Commission. Methane emissions. Directorate-General for Energy. Accessed August 10, 2026. https://energy.ec.europa.eu/topics/carbon-management-and-fossil-fuels/methane-emissions_en
- Confirmation
-
It looks like you're in the . If this is not your location, please select the correct region or country below.
You're headed to Hamamatsu Photonics website for GB (English). If you want to view an other country's site, the optimized information will be provided by selecting options below.
In order to use this website comfortably, we use cookies. For cookie details please see our cookie policy.
- Cookie Policy
-
This website or its third-party tools use cookies, which are necessary to its functioning and required to achieve the purposes illustrated in this cookie policy. By closing the cookie warning banner, scrolling the page, clicking a link or continuing to browse otherwise, you agree to the use of cookies.
Hamamatsu uses cookies in order to enhance your experience on our website and ensure that our website functions.
You can visit this page at any time to learn more about cookies, get the most up to date information on how we use cookies and manage your cookie settings. We will not use cookies for any purpose other than the ones stated, but please note that we reserve the right to update our cookies.
1. What are cookies?
For modern websites to work according to visitor’s expectations, they need to collect certain basic information about visitors. To do this, a site will create small text files which are placed on visitor’s devices (computer or mobile) - these files are known as cookies when you access a website. Cookies are used in order to make websites function and work efficiently. Cookies are uniquely assigned to each visitor and can only be read by a web server in the domain that issued the cookie to the visitor. Cookies cannot be used to run programs or deliver viruses to a visitor’s device.
Cookies do various jobs which make the visitor’s experience of the internet much smoother and more interactive. For instance, cookies are used to remember the visitor’s preferences on sites they visit often, to remember language preference and to help navigate between pages more efficiently. Much, though not all, of the data collected is anonymous, though some of it is designed to detect browsing patterns and approximate geographical location to improve the visitor experience.
Certain type of cookies may require the data subject’s consent before storing them on the computer.
2. What are the different types of cookies?
This website uses two types of cookies:
- First party cookies. For our website, the first party cookies are controlled and maintained by Hamamatsu. No other parties have access to these cookies.
- Third party cookies. These cookies are implemented by organizations outside Hamamatsu. We do not have access to the data in these cookies, but we use these cookies to improve the overall website experience.
3. How do we use cookies?
This website uses cookies for following purposes:
- Certain cookies are necessary for our website to function. These are strictly necessary cookies and are required to enable website access, support navigation or provide relevant content. These cookies direct you to the correct region or country, and support security and ecommerce. Strictly necessary cookies also enforce your privacy preferences. Without these strictly necessary cookies, much of our website will not function.
- Analytics cookies are used to track website usage. This data enables us to improve our website usability, performance and website administration. In our analytics cookies, we do not store any personal identifying information.
- Functionality cookies. These are used to recognize you when you return to our website. This enables us to personalize our content for you, greet you by name and remember your preferences (for example, your choice of language or region).
- These cookies record your visit to our website, the pages you have visited and the links you have followed. We will use this information to make our website and the advertising displayed on it more relevant to your interests. We may also share this information with third parties for this purpose.
Cookies help us help you. Through the use of cookies, we learn what is important to our visitors and we develop and enhance website content and functionality to support your experience. Much of our website can be accessed if cookies are disabled, however certain website functions may not work. And, we believe your current and future visits will be enhanced if cookies are enabled.
4. Which cookies do we use?
There are two ways to manage cookie preferences.
- You can set your cookie preferences on your device or in your browser.
- You can set your cookie preferences at the website level.
If you don’t want to receive cookies, you can modify your browser so that it notifies you when cookies are sent to it or you can refuse cookies altogether. You can also delete cookies that have already been set.
If you wish to restrict or block web browser cookies which are set on your device then you can do this through your browser settings; the Help function within your browser should tell you how. Alternatively, you may wish to visit www.aboutcookies.org, which contains comprehensive information on how to do this on a wide variety of desktop browsers.
5. What are Internet tags and how do we use them with cookies?
Occasionally, we may use internet tags (also known as action tags, single-pixel GIFs, clear GIFs, invisible GIFs and 1-by-1 GIFs) at this site and may deploy these tags/cookies through a third-party advertising partner or a web analytical service partner which may be located and store the respective information (including your IP-address) in a foreign country. These tags/cookies are placed on both online advertisements that bring users to this site and on different pages of this site. We use this technology to measure the visitors' responses to our sites and the effectiveness of our advertising campaigns (including how many times a page is opened and which information is consulted) as well as to evaluate your use of this website. The third-party partner or the web analytical service partner may be able to collect data about visitors to our and other sites because of these internet tags/cookies, may compose reports regarding the website’s activity for us and may provide further services which are related to the use of the website and the internet. They may provide such information to other parties if there is a legal requirement that they do so, or if they hire the other parties to process information on their behalf.
If you would like more information about web tags and cookies associated with on-line advertising or to opt-out of third-party collection of this information, please visit the Network Advertising Initiative website http://www.networkadvertising.org.
6. Analytics and Advertisement Cookies
We use third-party cookies (such as Google Analytics) to track visitors on our website, to get reports about how visitors use the website and to inform, optimize and serve ads based on someone's past visits to our website.
You may opt-out of Google Analytics cookies by the websites provided by Google:
https://tools.google.com/dlpage/gaoptout?hl=en
As provided in this Privacy Policy (Article 5), you can learn more about opt-out cookies by the website provided by Network Advertising Initiative:
http://www.networkadvertising.org
We inform you that in such case you will not be able to wholly use all functions of our website.
Close