![]()
Products


We are actively taking measures to improve product quality levels.
Applications


Why Hamamatsu?
Resources


Support


Our company


Investors


United Kingdom (EN)
Select your region or country.
Accessible Sensing Technology for Raman Spectroscopy
Spectroscopy, a field within the physical sciences, examines and employs the interactions between matter and electromagnetic radiation. The primary types of spectroscopy can be categorized based on whether we are measuring absorbed, reflected, emitted, transmitted, or scattered light of the sample, or if we are examining fluorescence.
Spectroscopy is a multifaceted field, with the second step of characterization further categorizaed according to wavelength range. This processincludes various forms of spectroscopy, including X-ray, visible, infrared, and microwave. Hamamatsu offers high-performance components and modules for both the visible (300-700 nm) and near-infrared (700-2500 nm) range, which has become increasingly popular in chemical, material, environmental, and other types of analyses.
Visible spectroscopy absorption is a process by which atoms and molecules can absorb light in the visible range through electronic transitions. When an atom or molecule absorbs light of the right energy or wavelength, it will result in a decrease in the amount of transmitted light. In the condensed phase (liquids and solids), visible light absorption occurs mainly from complex conjugated double bonds and aromatic rings present in organic molecules. However, it is important to note that many aqueous transition metal ions can also form strongly lightabsorbing species through complexions with associated water molecules in visible spectroscopy absorption. The diverse spectrum of hues that we observe in solids and liquids is a result of the absorption of light through electronic transitions. This process produces a broad array of colors that captivate our senses and leaves us in awe.
Figure 1: Types of spectroscopy

Within the near-infrared (NIR) spectrum, the energy present in the light is insufficient to activate the electronic transitions observed in the visible range. Consequently, the vividly colored compounds that appear in the visible range exert less impact on the NIR. In the NIR range, absorption of light occurs through vibrational transitions. This type of absorption causes an increase in the vibrational mode between two atoms bonded together in a molecule when the light has the appropriate energy or wavelength. As opposed to the visible range, NIR absorption does not necessitate conjugated bonds or solvent complexes. Thus, it is more responsive to the molecule’s structure and its interactions with other molecules in the vicinity. This sensitivity to the molecular structure and environment accounts for NIR spectroscopy’s efficacy. One of the most important NIR Spectroscopy techniques is Raman Scattering.
Figure 2: The principle of Raman spectroscopy

Raman spectroscopy relies on the vibrational modes of the crystals or molecules being analyzed. When light is directed at a material, some of it is scattered. The scattered light comprises both light with the same wavelength as the incident light (known as Rayleigh scattered light) and light with different wavelengths (known as Raman scattered light). Raman spectroscopy examines the properties of the Raman scattered light to identify the molecular or crystal structure of substances. This technique is suitable for analyzing most substances, including inorganic compounds, organic matter, solids, liquids, gases, and more, without the need for special pretreatment.
In Raman spectroscopy, the energy shift that occurs during Stokes scattering is referred to as the Raman shift, which is the parameter the technique aims to measure. However, Stokes scattering is significantly less likely to occur than Rayleigh scattering. Raman spectroscopy is a ‘fingerprint technique’, meaning that specific substances produce unique spectral signatures. The information obtained through Raman spectroscopy is diverse and rich.
Raman spectroscopy is particularly useful in the field of historical art authentication, as it can analyze the crystalline or molecular structure of paint to check its authenticity. Similarly, Raman spectroscopy is an excellent tool for analyzing crystalline samples in the semiconductor industry, as well as in the chemical and pharmaceutical industries since it is a point-and-shoot technique that requires no sample pre-treatment. The information derived from Raman spectroscopy can be classified into four main categories.
Figure 3: Four Raman spectroscopy categories

The first is the energy shift, or Raman shift, which provides general information about the crystal or molecule in the sample. The second is the intensity, which indicates the concentration of each substance. Thirdly, it is analyzing the shape of the peak and measuring the full width at half maximum to yield information about the crystalline structure. Lastly, potential peak deviations can provide insight into interactions with surrounding molecules, or they may be due to strain and distortion of the molecular structure.
We can easily see this for example in the spectrum of the different states of water in the figure below.
Figure 4: Spectrum of different states of water

We can see that the Raman signal of water vapor is a sharp peak, whereas liquid water and frozen ice have much broader peaks (due to their molecular interaction with the surrounding molecules).
One of the peculiar aspects of the Raman spectroscopy method is that this energy shift is independent of the excitation wavelength used. This means Raman spectroscopy can be performed across a broad energy range. Popular wavelengths are for example 532 nm, 785 nm, or 1,064 nm (common semiconductor laser diode wavelengths).
Figure 5: Intensity measurement of methanol

Figure 6: Comparison of the Raman spectrum of pure Methanol and Ethanol

As shown in the figure above, the two spectra have similar peaks corresponding also to the same wavelength, but Ethanol has further peaks, which are distinct. This difference is because Ethanol is a larger molecule so there are more and different vibration modes that can be excited by Raman spectroscopy.
The examples shown previously demonstrate highquality Raman spectra with excellent spectral resolution and signal-to-noise ratio. However, obtaining such high-quality spectra is not a trivial task due to the low probability of Stokes scattering compared to Rayleigh scattering, which is larger by factors of millions to billions.
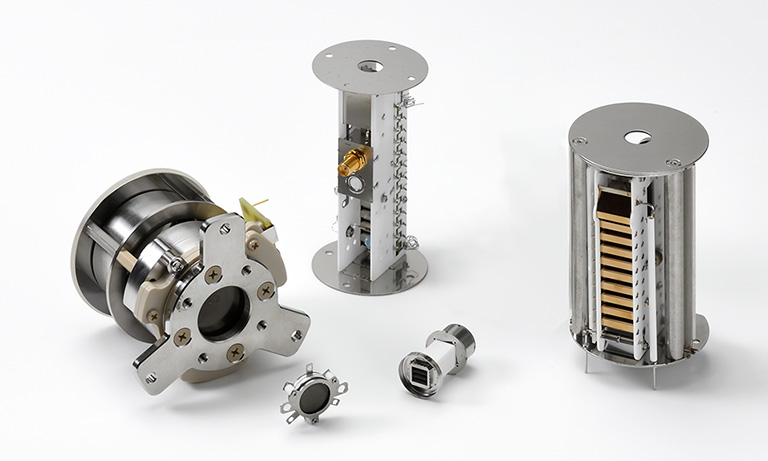
A standard Raman spectroscopy setup consists of three key elements: a coherent light source (typically a laser), optical components such as mirrors, gratings, and filters, and a sensitive sensor for signal acquisition. The relevant spectral region for Raman spectroscopy is typically the visible and near-infrared part of the spectrum, and a detector with high sensitivity is required to detect the extremely faint Raman scattered light. Linear image sensors are commonly used to simultaneously detect multiple wavelengths that are dispersed.
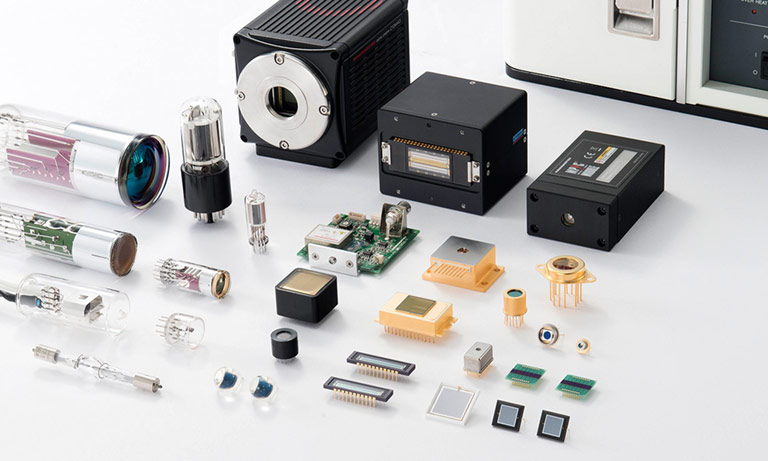
Hamamatsu Photonics is a leading supplier of high-quality, high-performance, and affordable CMOS technology for industrial, analytical, and spectroscopy markets. With extensive experience in the field of photonics technology including optics, electronics, mechanics, and software, we offer a wide product portfolio including CCD (with TDICCD), NMOS, and CMOS.
Our new CMOS linear image sensor, S16596-4096-11, builds upon the advantages of the previous model, with a longer pixel size (7x200 μm), 4096 pixels, a maximum data rate of 10 MHz, low readout noise (typ. 0.4 mV rms), high dynamic range (5000 times). It includes key functions such as simultaneous charge integration for all pixels, variable integration time, an electronic shutter, and a built-in timing generator. The S16596-4096-11 sensor also boasts higher sensitivity, making it an excellent choice for Raman spectroscopy applications.
Figure 7: Comparison with the previous model

Figure 8: Typical output of the readout board
The vertical axis indicates the sensor output. The horizontal axis indicates the number of pixels.

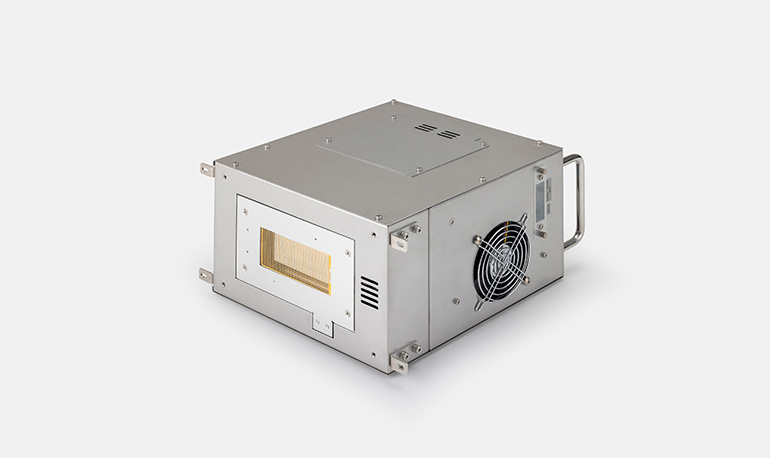
In addition to the sensor, we can provide a driver circuit that offers a 16-bit digital output and is compatible with USB 2.0 interfaces. The power supply is DC+5V, which can be provided via the USB bus power. The readout frequency of the driver circuit is 10MHz, and the size of the Sensor Board is 20 x 41.6 mm, while the Interface Board measures 45 x 50 mm. In addition, the external synchronization operation is available with this driver circuit.
If you want to test this CMOS for your application, an evaluation board comprising sensor and readout boards, and lens mount (F-mount) is available.
- Confirmation
-
It looks like you're in the . If this is not your location, please select the correct region or country below.
You're headed to Hamamatsu Photonics website for GB (English). If you want to view an other country's site, the optimized information will be provided by selecting options below.
In order to use this website comfortably, we use cookies. For cookie details please see our cookie policy.
- Cookie Policy
-
This website or its third-party tools use cookies, which are necessary to its functioning and required to achieve the purposes illustrated in this cookie policy. By closing the cookie warning banner, scrolling the page, clicking a link or continuing to browse otherwise, you agree to the use of cookies.
Hamamatsu uses cookies in order to enhance your experience on our website and ensure that our website functions.
You can visit this page at any time to learn more about cookies, get the most up to date information on how we use cookies and manage your cookie settings. We will not use cookies for any purpose other than the ones stated, but please note that we reserve the right to update our cookies.
1. What are cookies?
For modern websites to work according to visitor’s expectations, they need to collect certain basic information about visitors. To do this, a site will create small text files which are placed on visitor’s devices (computer or mobile) - these files are known as cookies when you access a website. Cookies are used in order to make websites function and work efficiently. Cookies are uniquely assigned to each visitor and can only be read by a web server in the domain that issued the cookie to the visitor. Cookies cannot be used to run programs or deliver viruses to a visitor’s device.
Cookies do various jobs which make the visitor’s experience of the internet much smoother and more interactive. For instance, cookies are used to remember the visitor’s preferences on sites they visit often, to remember language preference and to help navigate between pages more efficiently. Much, though not all, of the data collected is anonymous, though some of it is designed to detect browsing patterns and approximate geographical location to improve the visitor experience.
Certain type of cookies may require the data subject’s consent before storing them on the computer.
2. What are the different types of cookies?
This website uses two types of cookies:
- First party cookies. For our website, the first party cookies are controlled and maintained by Hamamatsu. No other parties have access to these cookies.
- Third party cookies. These cookies are implemented by organizations outside Hamamatsu. We do not have access to the data in these cookies, but we use these cookies to improve the overall website experience.
3. How do we use cookies?
This website uses cookies for following purposes:
- Certain cookies are necessary for our website to function. These are strictly necessary cookies and are required to enable website access, support navigation or provide relevant content. These cookies direct you to the correct region or country, and support security and ecommerce. Strictly necessary cookies also enforce your privacy preferences. Without these strictly necessary cookies, much of our website will not function.
- Analytics cookies are used to track website usage. This data enables us to improve our website usability, performance and website administration. In our analytics cookies, we do not store any personal identifying information.
- Functionality cookies. These are used to recognize you when you return to our website. This enables us to personalize our content for you, greet you by name and remember your preferences (for example, your choice of language or region).
- These cookies record your visit to our website, the pages you have visited and the links you have followed. We will use this information to make our website and the advertising displayed on it more relevant to your interests. We may also share this information with third parties for this purpose.
Cookies help us help you. Through the use of cookies, we learn what is important to our visitors and we develop and enhance website content and functionality to support your experience. Much of our website can be accessed if cookies are disabled, however certain website functions may not work. And, we believe your current and future visits will be enhanced if cookies are enabled.
4. Which cookies do we use?
There are two ways to manage cookie preferences.
- You can set your cookie preferences on your device or in your browser.
- You can set your cookie preferences at the website level.
If you don’t want to receive cookies, you can modify your browser so that it notifies you when cookies are sent to it or you can refuse cookies altogether. You can also delete cookies that have already been set.
If you wish to restrict or block web browser cookies which are set on your device then you can do this through your browser settings; the Help function within your browser should tell you how. Alternatively, you may wish to visit www.aboutcookies.org, which contains comprehensive information on how to do this on a wide variety of desktop browsers.
5. What are Internet tags and how do we use them with cookies?
Occasionally, we may use internet tags (also known as action tags, single-pixel GIFs, clear GIFs, invisible GIFs and 1-by-1 GIFs) at this site and may deploy these tags/cookies through a third-party advertising partner or a web analytical service partner which may be located and store the respective information (including your IP-address) in a foreign country. These tags/cookies are placed on both online advertisements that bring users to this site and on different pages of this site. We use this technology to measure the visitors' responses to our sites and the effectiveness of our advertising campaigns (including how many times a page is opened and which information is consulted) as well as to evaluate your use of this website. The third-party partner or the web analytical service partner may be able to collect data about visitors to our and other sites because of these internet tags/cookies, may compose reports regarding the website’s activity for us and may provide further services which are related to the use of the website and the internet. They may provide such information to other parties if there is a legal requirement that they do so, or if they hire the other parties to process information on their behalf.
If you would like more information about web tags and cookies associated with on-line advertising or to opt-out of third-party collection of this information, please visit the Network Advertising Initiative website http://www.networkadvertising.org.
6. Analytics and Advertisement Cookies
We use third-party cookies (such as Google Analytics) to track visitors on our website, to get reports about how visitors use the website and to inform, optimize and serve ads based on someone's past visits to our website.
You may opt-out of Google Analytics cookies by the websites provided by Google:
https://tools.google.com/dlpage/gaoptout?hl=en
As provided in this Privacy Policy (Article 5), you can learn more about opt-out cookies by the website provided by Network Advertising Initiative:
http://www.networkadvertising.org
We inform you that in such case you will not be able to wholly use all functions of our website.
Close