![]()
Products


We are actively taking measures to improve product quality levels.
Applications


Why Hamamatsu?
Resources


Support


Our company


Investors


United Kingdom (EN)
Select your region or country.

Differences between single-wavelength imaging and two-wavelength ratio imaging
Disadvantage of single-wavelength imaging
In calcium imaging, directly interpreting changes in the fluorescence intensity of simple Ca2+ probes as the dynamics of the desired phenomenon or target molecule can lead to inaccurate measurements. The fluorescence intensity detected from Ca2+ probes varies due to factors such as fading of the fluorescent probe, variations in localization concentration, and sample movement. These variations are artifacts caused by technical measurement issues.
The following is a schematic explanation of the effects of the state of the sample and fluorescent probe on fluorescence brightness, using as an example the measurement of changes in intracellular calcium concentration using a fluorescent probe with a single wavelength whose fluorescence brightness changes in accordance with calcium ion concentration.
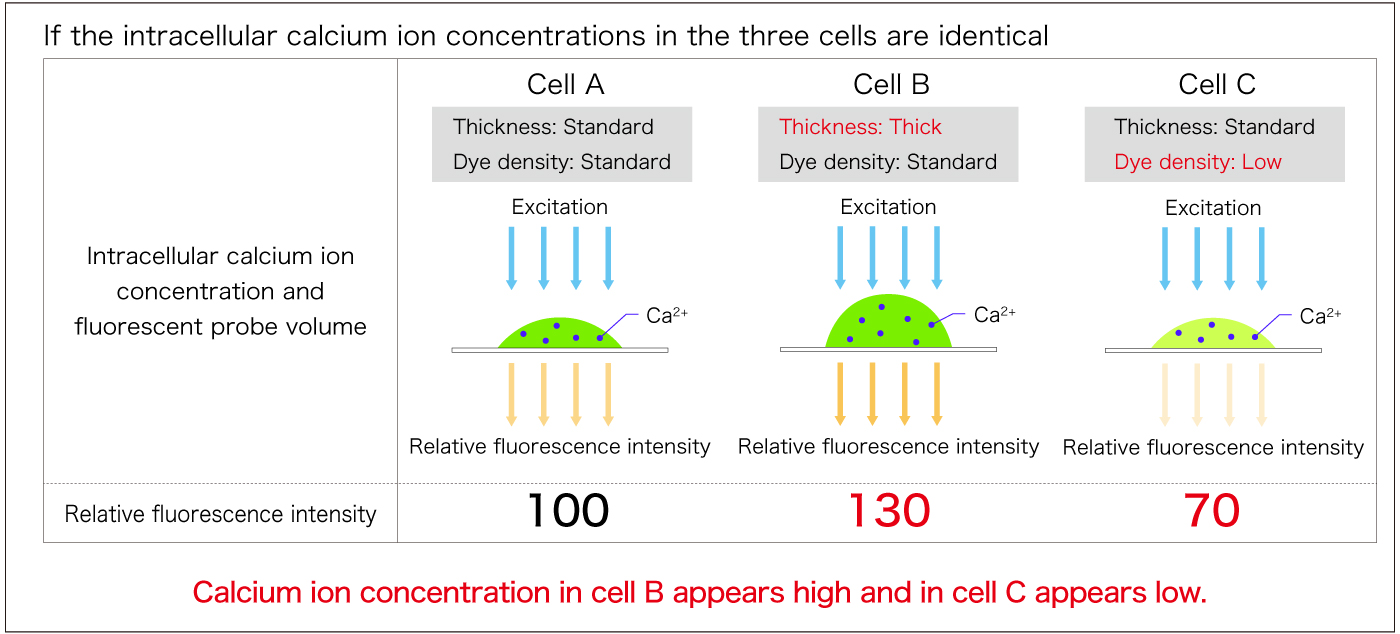
Figure 1: Single wavelength - when the intracellular calcium ion concentration is the same in three cells (cells A, B, and C)
In Figure 1, we have cells A, B, and C, assuming that their resting intracellular calcium ion concentrations are the same. Additionally, let’s consider that cell B has greater thickness compared to cell A, while cell C has absorbed less pigment than cell A. When each cell is excited under the same conditions, the resulting fluorescence intensity, relative to cell A (which we set as 100 %), is approximately 130 % for cell B due to its greater fluorescent dye content. On the other hand, cell C, with lower fluorescent dye content, exhibits a relative fluorescence intensity of about 70 %.
Keep in mind that fluorescence intensity also depends on the probe’s abundance. Therefore, if we rely solely on fluorescence intensity as an indicator, even when intracellular calcium ion concentrations are identical, cell B may appear to have higher calcium ion concentration, and cell C may appear to have lower calcium ion concentration.
Next, we will use the case where the intracellular calcium ion concentration in cell A increases due to stimulation of only cell A, and the fluorescence brightness increases by 30 % compared to the level before stimulation of cell A.
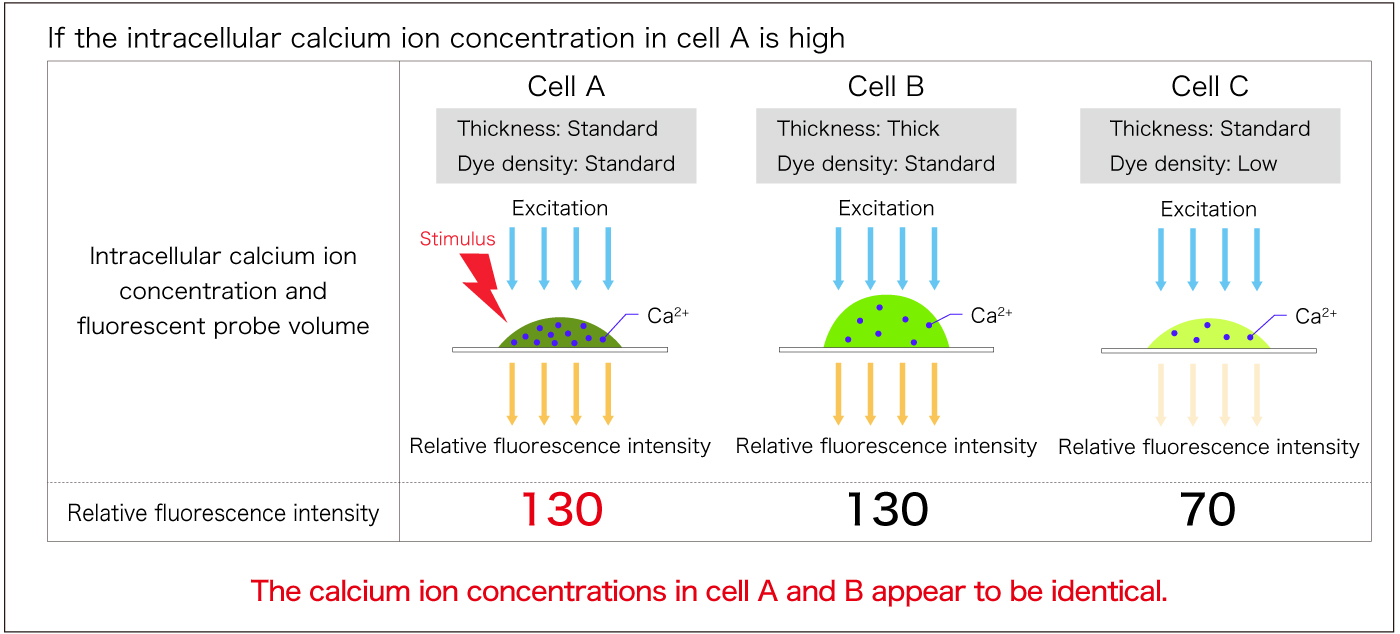
Figure 2: Single wavelength - when the intracellular calcium ion concentration is high in cell A
In the state depicted in Figure 2, despite the different intracellular calcium ion concentrations between cell A and cell B, the fluorescence intensity of both cell A and cell B remains the same. As a result, it becomes difficult to discern the difference in calcium ion concentration between the two cells.
In fluorescence live imaging, measured fluorescence intensity values are influenced by sample and fluorescent probe conditions. Thus, we need to consider various interpretations of what the measurement value means.
Overview of two-wavelength ratio imaging
Ratio imaging is a measurement technique that obtains an image based on the ratio of fluorescence intensities from two different fluorescent wavelengths (referred to as the ‘ratio value’). By calculating the ratio between the two wavelengths, it corrects for fluorescence intensity components unrelated to the actual measurement target, such as variations due to sample or fluorescent probe conditions and environmental changes. This method is widely used to achieve more accurate and quantitative imaging.
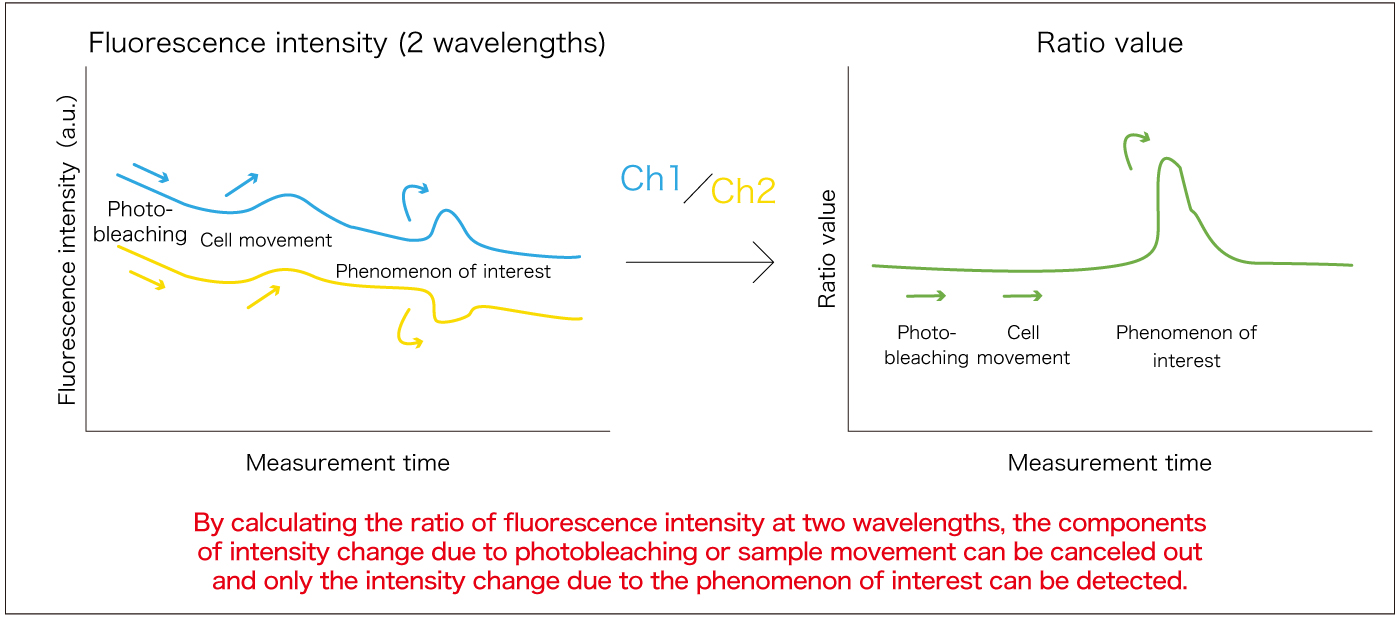
Figure 3: Principle of ratio imaging
In Figure 3, the typical temporal variation of fluorescence intensity obtained using ratio fluorescent probes is schematically shown. Even with sample movement or fading, fluctuations in fluorescence intensity occur with ratio fluorescent probes. In this case, the two fluorescence intensities exhibit the same upward and downward trends. Since the numerator and denominator intensity values change in sync, the ratio value of the two fluorescence intensities remains constant.
On the other hand, ratio fluorescent probes are designed so that the changes in two types of fluorescence intensity related to the phenomenon of interest are mirror images of each other. For example, in the case of measuring calcium ion concentration using a fluorescent probe, one fluorescence increases in brightness as calcium ion concentration rises, while the other fluorescence decreases in brightness as calcium ion concentration increases. As a result, significant changes are observed in the ratio value.
By comparing the ratio value of fluorescence intensity over time, it is possible to cancel out the simple brightness variations due to sample movement or fading and extract only the brightness changes related to the desired phenomenon.
Using ratio imaging not only allows tracking of temporal variations but also facilitates comparisons between cells. Taking the example of measuring intracellular calcium ion concentration using two-wavelength fluorescent probes, we can illustrate how the ratio value provides useful information under various measurement conditions.
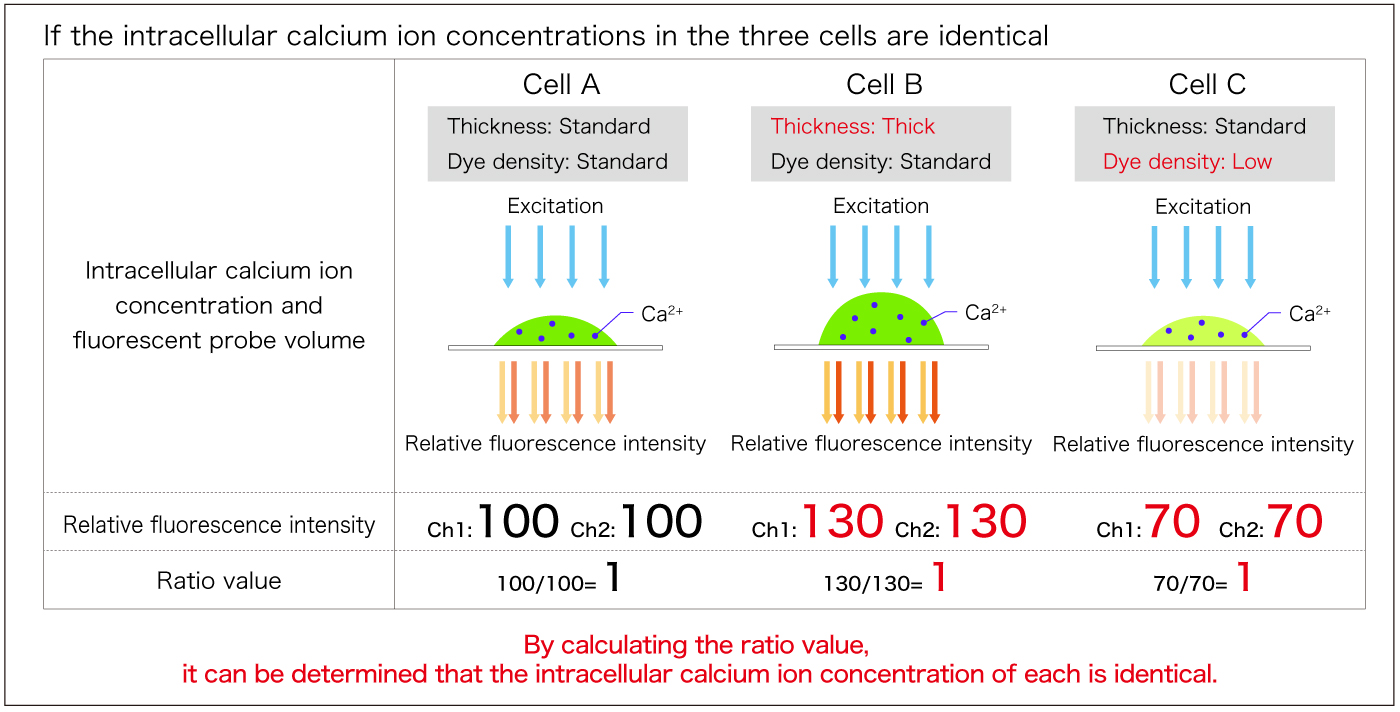
Figure 4: 2 wavelengths - when the intracellular calcium ion concentrations of the three cells are identical (cells A, B, and C)
In Figure 4, similar to Figure 1, we have cells A, B, and C, assuming that their resting calcium ion concentrations are the same. Cell B has greater thickness compared to cell A, while cell C has lower pigment uptake than cell A. The fluorescence intensity is 100 % for cell A, 130 % for cell B, and 70 % for cell C. Let’s denote the intensity values from the two fluorescence wavelengths separately as Ch1 and Ch2. When calcium ion concentration remains constant, the intensity values depend on the presence of pigment in both Ch1 and Ch2. Therefore, cell B exhibits higher Ch1 intensity and also higher Ch2 intensity, while cell C has lower Ch1 and Ch2 intensities. The ratio values (referred to as the ratio) remain the same for cells A, B, and C. Consequently, using the ratio value, we can distinguish between cells with thick structures (which might lead to higher intensity in single-wavelength measurements) and cells with lower pigment uptake or fading (which might incorrectly suggest lower calcium ion concentration). Comparing the ratio values reveals that the calcium concentrations in these cells are indeed identical.
Next, in Figure 5, let’s consider the case where only cell A is stimulated, and the intracellular calcium ion concentration in cell A increases, resulting in a 30 % increase in Ch1 fluorescence brightness compared to before stimulation of cell A. The following is an explanation.

Figure 5: 2 wavelengths - when the concentration of calcium ions in cell A is high
Due to the properties of the ratiometric fluorescent probe, when the calcium ion concentration increases, the fluorescence intensity of Ch2 decreases inversely and becomes 70 %. When comparing only Ch1, cells A and B have the same brightness value. However, when calculating the ratio value, cell A has a value of 1.86, while cell B has a value of 1. This difference indicates that the intracellular calcium concentration in cell A is higher than in cell B.
As we have seen so far, in fluorescence live imaging, fluorescence intensity varies due to various factors, and obtaining useful information from simple brightness has limitations. Ratiometric imaging allows us to remove variations in brightness caused by the sample or fluorescent probe environment, enabling more accurate observation of the intended phenomenon.
Up to this point, we have schematically demonstrated the factors influencing fluorescence intensity in live imaging and the benefits of ratiometric imaging. On the next page, we will explain how to capture biological phenomena using ratiometric imaging with actual measurement data.
Calcium imaging related products
Other experimental methods
- Confirmation
-
It looks like you're in the . If this is not your location, please select the correct region or country below.
You're headed to Hamamatsu Photonics website for GB (English). If you want to view an other country's site, the optimized information will be provided by selecting options below.
In order to use this website comfortably, we use cookies. For cookie details please see our cookie policy.
- Cookie Policy
-
This website or its third-party tools use cookies, which are necessary to its functioning and required to achieve the purposes illustrated in this cookie policy. By closing the cookie warning banner, scrolling the page, clicking a link or continuing to browse otherwise, you agree to the use of cookies.
Hamamatsu uses cookies in order to enhance your experience on our website and ensure that our website functions.
You can visit this page at any time to learn more about cookies, get the most up to date information on how we use cookies and manage your cookie settings. We will not use cookies for any purpose other than the ones stated, but please note that we reserve the right to update our cookies.
1. What are cookies?
For modern websites to work according to visitor’s expectations, they need to collect certain basic information about visitors. To do this, a site will create small text files which are placed on visitor’s devices (computer or mobile) - these files are known as cookies when you access a website. Cookies are used in order to make websites function and work efficiently. Cookies are uniquely assigned to each visitor and can only be read by a web server in the domain that issued the cookie to the visitor. Cookies cannot be used to run programs or deliver viruses to a visitor’s device.
Cookies do various jobs which make the visitor’s experience of the internet much smoother and more interactive. For instance, cookies are used to remember the visitor’s preferences on sites they visit often, to remember language preference and to help navigate between pages more efficiently. Much, though not all, of the data collected is anonymous, though some of it is designed to detect browsing patterns and approximate geographical location to improve the visitor experience.
Certain type of cookies may require the data subject’s consent before storing them on the computer.
2. What are the different types of cookies?
This website uses two types of cookies:
- First party cookies. For our website, the first party cookies are controlled and maintained by Hamamatsu. No other parties have access to these cookies.
- Third party cookies. These cookies are implemented by organizations outside Hamamatsu. We do not have access to the data in these cookies, but we use these cookies to improve the overall website experience.
3. How do we use cookies?
This website uses cookies for following purposes:
- Certain cookies are necessary for our website to function. These are strictly necessary cookies and are required to enable website access, support navigation or provide relevant content. These cookies direct you to the correct region or country, and support security and ecommerce. Strictly necessary cookies also enforce your privacy preferences. Without these strictly necessary cookies, much of our website will not function.
- Analytics cookies are used to track website usage. This data enables us to improve our website usability, performance and website administration. In our analytics cookies, we do not store any personal identifying information.
- Functionality cookies. These are used to recognize you when you return to our website. This enables us to personalize our content for you, greet you by name and remember your preferences (for example, your choice of language or region).
- These cookies record your visit to our website, the pages you have visited and the links you have followed. We will use this information to make our website and the advertising displayed on it more relevant to your interests. We may also share this information with third parties for this purpose.
Cookies help us help you. Through the use of cookies, we learn what is important to our visitors and we develop and enhance website content and functionality to support your experience. Much of our website can be accessed if cookies are disabled, however certain website functions may not work. And, we believe your current and future visits will be enhanced if cookies are enabled.
4. Which cookies do we use?
There are two ways to manage cookie preferences.
- You can set your cookie preferences on your device or in your browser.
- You can set your cookie preferences at the website level.
If you don’t want to receive cookies, you can modify your browser so that it notifies you when cookies are sent to it or you can refuse cookies altogether. You can also delete cookies that have already been set.
If you wish to restrict or block web browser cookies which are set on your device then you can do this through your browser settings; the Help function within your browser should tell you how. Alternatively, you may wish to visit www.aboutcookies.org, which contains comprehensive information on how to do this on a wide variety of desktop browsers.
5. What are Internet tags and how do we use them with cookies?
Occasionally, we may use internet tags (also known as action tags, single-pixel GIFs, clear GIFs, invisible GIFs and 1-by-1 GIFs) at this site and may deploy these tags/cookies through a third-party advertising partner or a web analytical service partner which may be located and store the respective information (including your IP-address) in a foreign country. These tags/cookies are placed on both online advertisements that bring users to this site and on different pages of this site. We use this technology to measure the visitors' responses to our sites and the effectiveness of our advertising campaigns (including how many times a page is opened and which information is consulted) as well as to evaluate your use of this website. The third-party partner or the web analytical service partner may be able to collect data about visitors to our and other sites because of these internet tags/cookies, may compose reports regarding the website’s activity for us and may provide further services which are related to the use of the website and the internet. They may provide such information to other parties if there is a legal requirement that they do so, or if they hire the other parties to process information on their behalf.
If you would like more information about web tags and cookies associated with on-line advertising or to opt-out of third-party collection of this information, please visit the Network Advertising Initiative website http://www.networkadvertising.org.
6. Analytics and Advertisement Cookies
We use third-party cookies (such as Google Analytics) to track visitors on our website, to get reports about how visitors use the website and to inform, optimize and serve ads based on someone's past visits to our website.
You may opt-out of Google Analytics cookies by the websites provided by Google:
https://tools.google.com/dlpage/gaoptout?hl=en
As provided in this Privacy Policy (Article 5), you can learn more about opt-out cookies by the website provided by Network Advertising Initiative:
http://www.networkadvertising.org
We inform you that in such case you will not be able to wholly use all functions of our website.
Close