![]()
Products


We are actively taking measures to improve product quality levels.
Applications


Why Hamamatsu?
Resources


Support


Our company


Investors


United Kingdom (EN)
Select your region or country.


Spectral Urine Analysis for Non-Invasive, Rapid Diagnosis: The Future of Liquid Biopsy
Early diagnosis plays a pivotal role in the effective treatment of diseases, particularly in oncology. However, the absence of apparent clinical symptoms and the limitations of conventional screening methods present significant challenges. To address this gap, medical science is exploring innovative diagnostic platforms, among which liquid biopsy has emerged as a promising technique. Introduced initially to detect circulating tumor cells (CTCs) in the bloodstream, liquid biopsy now encompasses a broader range of body fluids, including cerebrospinal fluid, saliva, pleural effusion, and most notably, urine.
Why Urine?
Urine offers a unique window into human health. As a biological fluid that is readily obtainable through noninvasive methods and widely accepted by patients, urine is increasingly being recognized for its diagnostic potential. It reflects the metabolic state of various organs and can indicate both inflammatory and neoplastic processes. With the presence of metabolites and biomarkers, urine becomes an ideal candidate for spectral analysis.
Traditional Urine Analysis Methods
A cornerstone of diagnostic medicine, urine analysis can be traced back to ancient times. These traditional methods, though still widely used, have limitations in scope, precision, and speed.
Culture Tests
Used for diagnosing infections, urine cultures are the gold standard for identifying bacterial species and determining antibiotic sensitivity. However they delay diagnosis with incubation times of 24–72 hours.
Urinanalysis Dipstick Tests
Colorimetric tests are commonly used in clinical settings for quick screening. Dipsticks detect a range of parameters such as pH, glucose, protein, ketones, bilirubin, and blood. They are useful, but semi-quantitative, can be subject to user error, and often provide only a basic overview.
Urine Microscopy
Urine sediment examination under a microscope is used to detect cells (RBCs, WBCs), casts, crystals, and bacteria. Though informative, microscopy is laborintensive, requires trained personnel, and may lack sensitivity for low-abundance biomarkers.
Chemical Assays and Enzymatic Methods
These tests measure specific substances (e.g., creatinine, urea, or albumin) with higher accuracy than dipsticks. They aren’t always ideal as they require sample preparation, reagents, and laboratory infrastructure, and are typically time-consuming.
Spectral Techniques in Urine Analysis
Recent technological advancements have enabled the use of optical (spectral) methods to analyze urine at the molecular level, offering rapid, accurate, and non-invasive diagnostic alternatives. These techniques rely on the interaction of light with urine molecules, capturing spectral signatures that reveal both qualitative and quantitative information.
Raman Spectroscopy
Raman spectroscopy measures the inelastic scattering of monochromatic light—typically from a laser—as it interacts with molecular vibrations. It is highly sensitive and can detect trace amounts of substances. This method has proven especially effective in identifying:
- Drugs of abuse (e.g., opioids, amphetamines, MDMA)
- Therapeutic agents (e.g., benzodiazepines, antipsychotics)
- Doping substances (e.g., erythropoietin, ephedrine)
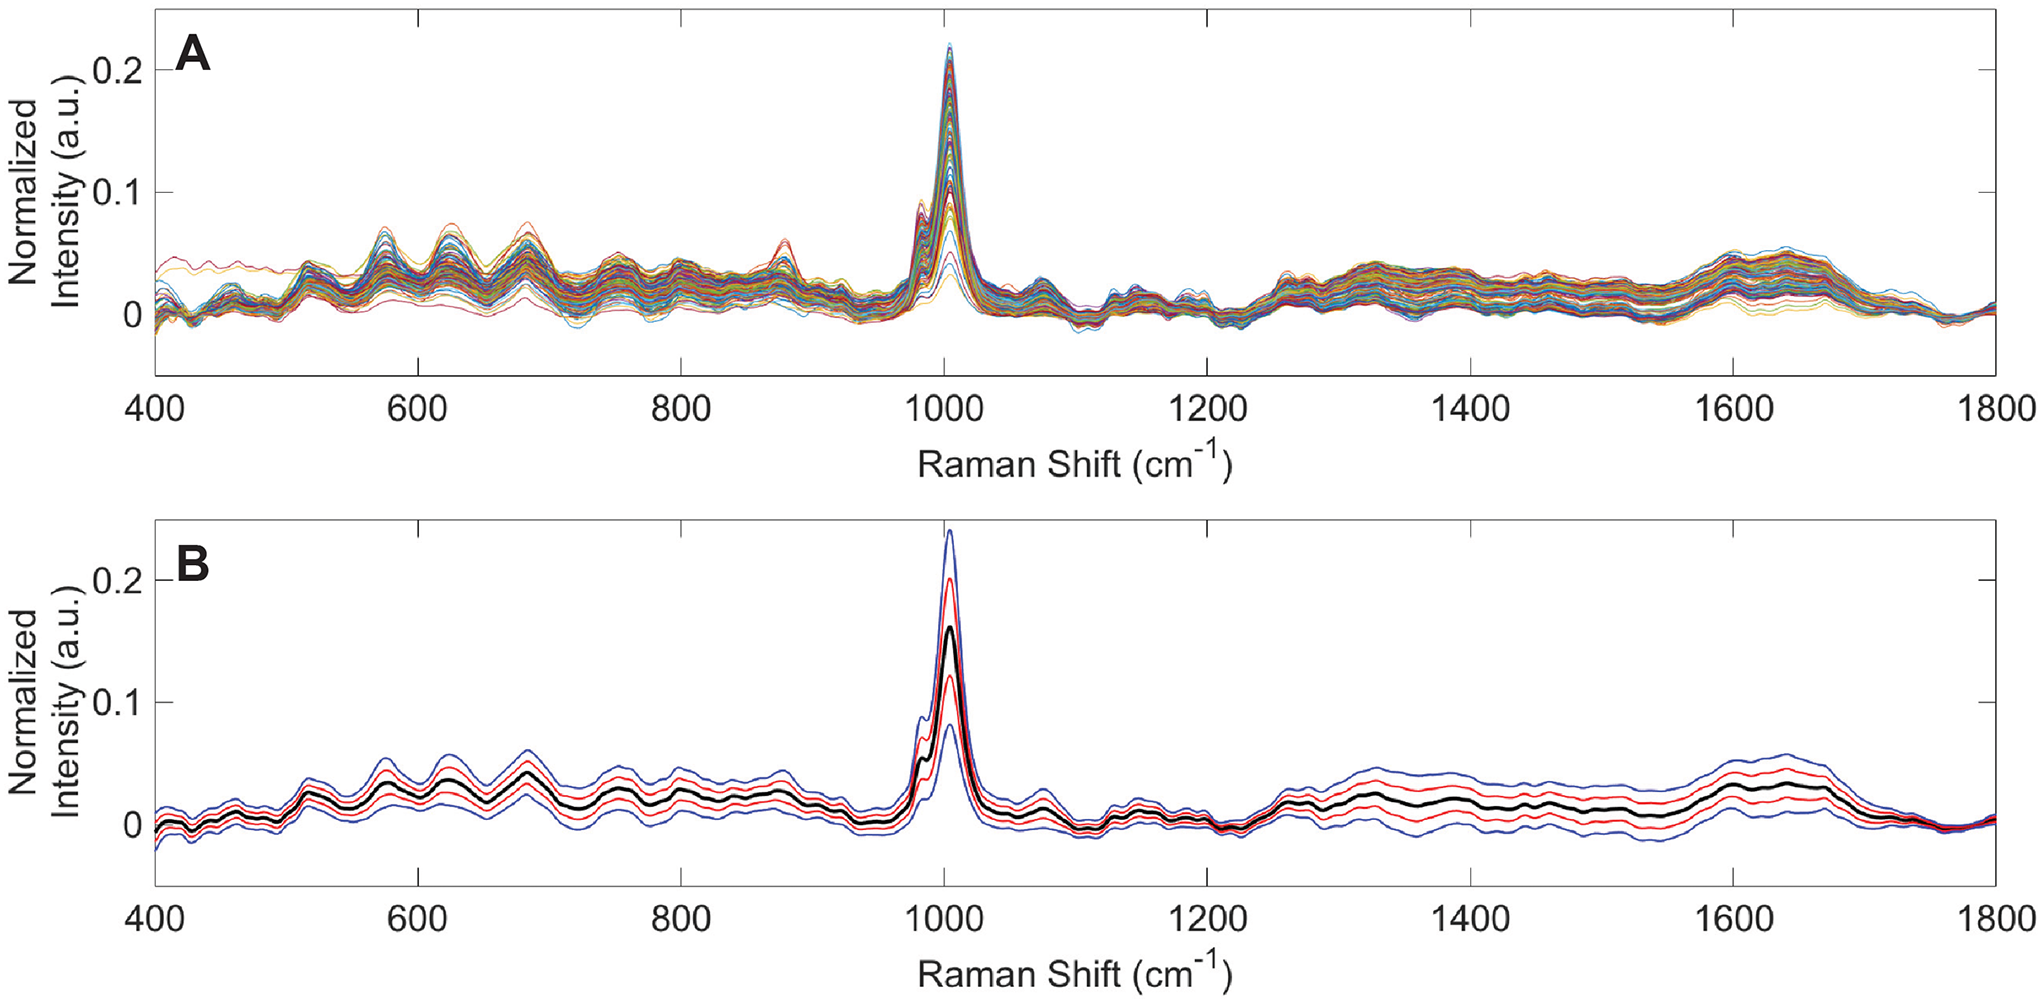
Spectral characteristics of urine specimens from healthy human volunteers analyzed using Raman chemometric urinalysis (Rametrix), Senger RS, Kavuru V, Sullivan M, Gouldin A, Lundgren S, Merrifield K, et al. (2019) [1]
Raman spectra from 235 urine specimens obtained using 735 nm (30 mW) laser excitation. (A) Overlaid vector-normalized spectra. (B) Average urine spectrum (black) with 1 (red) and 2 (blue) standard deviation ranges. Notable peaks appear at 1006 cm–¹ (Urea) and 1640 cm–¹ (Water).
Fourier Transform Infrared Spectroscopy (FTIR)
FTIR captures high-resolution spectral fingerprints of urine, enabling the detection of proteins, lipids, cells, and even pathogens. Combined with computational techniques such as principal component analysis (PCA) and Soft Independent Modeling of Class Analogy (SIMCA), FTIR has demonstrated strong clinical potential, including the ability to distinguish kidney donors at risk of organ rejection.

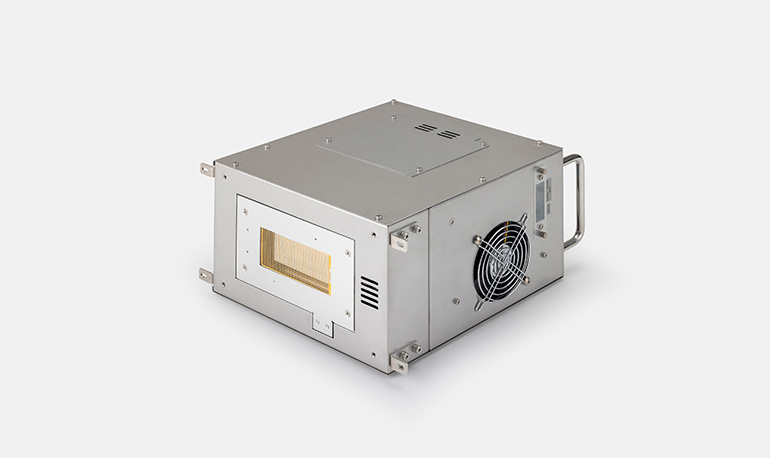
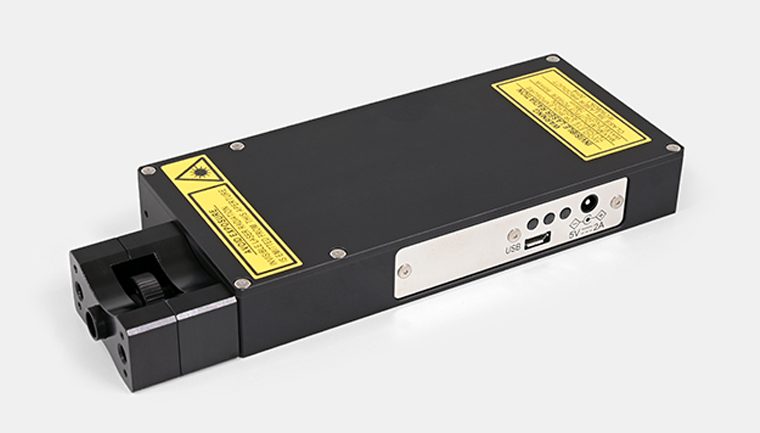
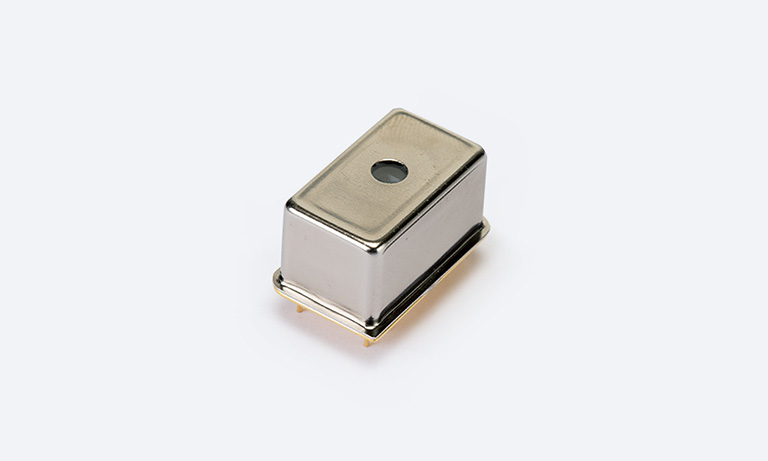
Hamamatsu's C16511-01 FTIR engine, high-speed and compact near infrared spectrometer that can be incorporated into inline process.
Visible (VIS) and Near-Infrared (NIR) Spectrometry
These techniques use a broadband light source that transmits or reflects through the urine sample. A spectrometer then detects the specific wavelengths absorbed by the sample. This allows for the assessment of a broad range of biomarkers which can be indicators of several dysfunctions:
- Hydration and renal function: Urine osmolality, specific gravity, creatinine
- Metabolic health: Uric acid, urea, citrate, oxalate
- Infection and inflammation: White/red blood cells, bacteria, albumin, total protein
Although inorganic ions do not directly absorb NIR light, they affect spectral patterns through ion–water interactions. Likewise, urine saturation and crystallization (e.g., calcium oxalate) can be detected optically. Measuring urine saturation and crystallization is vital for preventing, diagnosing, and managing kidney stones and urinary tract conditions. For example, early detection of supersaturated urine can enable timely dietary, hydration, or pharmacological interventions to prevent stone formation.
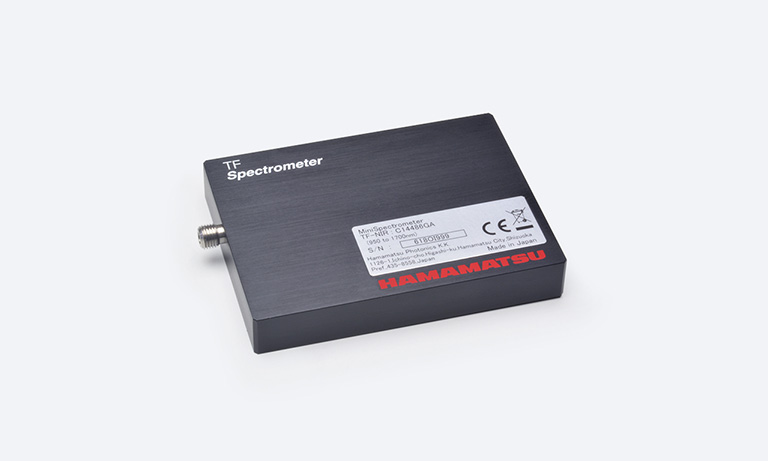
Hamamatsu's TF series C14486GA minispectrometer, for near-infrared range, compact / thin case with InGaAs linear image sensor mounted.
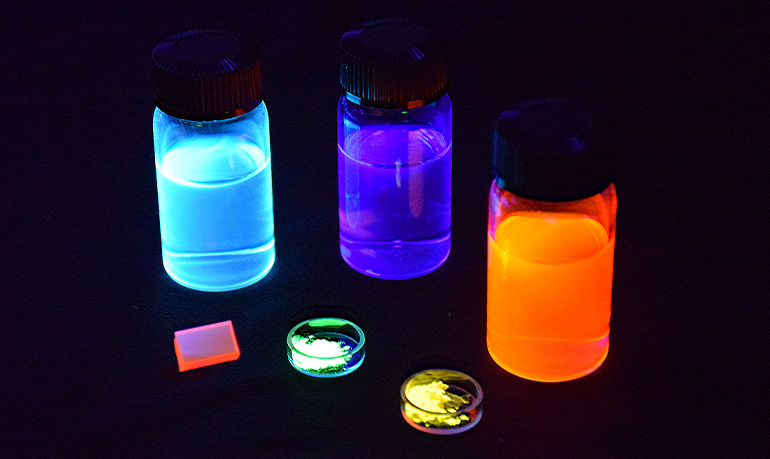
Fluorescence Spectrometry
This method measures light emissions from substances that have absorbed energy, typically UV or visible light. Fluorescence spectrometry detects endogenous fluorophores such as:
- NADH and FAD (indicators of mitochondrial function)
- Tryptophan (linked to protein metabolism and cellular activity)
- Porphyrins (associated with heme synthesis and certain cancers)
Abnormal levels of these compounds may reflect mitochondrial stress, cellular damage, inflammation, neoplastic changes, or metabolic disorders. For instance, hematuria (blood in urine) can be confirmed by detecting fluorescence emissions between 450–520 nm, in addition to visible color change.
Hamamatsu's C12666MA mini-spectrometer, fingertip size, ultra-compact spectrometer head integrating MEMS and image sensor technologies
Complementary Sensing-Conductimetry
Spectral methods are enhanced by combining them with conductimetry, which measures the urine’s electrical conductivity to assess total ion concentration. This dual approach improves diagnostic accuracy and reduces false negatives, especially when adjusted for sample temperature.
Advantages of Spectral Methods Over Traditional Techniques
| Features | Traditional Methods | Spectral (Optical) Methods |
|---|---|---|
| Invasiveness | Non-invasive | Non-invasive |
| Speed | Minutes to days (e.g., cultures) | Seconds to minutes |
| Sample preparation | Often required | Minimal or none |
| Quantitative precision | Limited to lab-based tests | High precision, multi-parametric |
| Biomarker range | Narrow (specific targets) | Broad (metabolic + structural) |
| Operator dependency | Moderate to high | Low (automated, software-assisted) |
| Repeatability | Variable; risk of degradation | High; samples remain intact |
| Data richness | Low to moderate | High (full spectral fingerprint) |
A New Era in Diagnostics
By integrating visible, infrared, and fluorescence spectrometry with conductimetry into compact analytical platforms, modern urine analyzers are transforming diagnostic medicine. These devices enable clinicians to perform rapid and reliable assessments across a broad spectrum of biomarkers. What was once limited to specialized laboratories can now be conducted in near real-time, offering new possibilities for early disease detection, treatment monitoring, and risk assessment, all without the need for invasive procedures.
As these technologies continue to evolve, the potential for point-of-care and even home-based applications becomes increasingly feasible. Spectral urine analysis is poised to shift diagnostics from the lab bench to the bedside and beyond, making precision healthcare more accessible, efficient, and patient-friendly.
Hamamatsu, with its highly reliable, sensitive, and miniaturized spectral solutions, is playing a pivotal role in this transformation. By enabling more compact and accurate sensing platforms, Hamamatsu is making a significant contribution to the advancement of medical diagnostics, helping to bring innovative, non-invasive tools into everyday clinical practice.
References
[1] Senger RS, Kavuru V, Sullivan M, Gouldin A, Lundgren S, Merrifield K, et al. (2019) Spectral characteristics of urine specimens from healthy human volunteers analyzed using Raman chemometric urinalysis (Rametrix). PLoS ONE 14(9): e0222115 [Online]. Available: https://doi.org/10.1371/journal. pone.0222115
- Vigo, F.; Tozzi, A.; Disler, M.; Gisi, A.; Kavvadias, V.; Kavvadias, T. Vibrational Spectroscopy in Urine Samples as a Medical Tool: Review and Overview on the Current State-of-the-Art. Diagnostics 2023, 13, 27 [Online]. Available: https:// doi.org/10.3390/diagnostics13010027
- Li, J.; Wang, C.; Meng, Q.; Hu, Z.; Hu, M.; Zhang, M. MicroRNAs in urine as diagnostic biomarkers for multiple myeloma. Int. J.Lab. Hematol. 2020, 43, 227–234. [CrossRef] [PubMed]
- Brouwer-Brolsma, E.M.; Brennan, L.; Drevon, C.A.; van Kranen, H.; Manach, C.; Dragsted, L.O.; Roche, H.M.; Andres-Lacueva, C.; Bakker, S.J.L.; Bouwman, J.; et al. Combining traditional dietary assessment methods with novel metabolomics techniques: Present efforts by the Food Biomarker Alliance. Proc. Nutr. Soc. 2017, 76, 619–627. [CrossRef] [PubMed]]
- USense, "Hand-held urine analyzer integrating spectral and electrical measurements," U.S. Patent Application US2024102987A1, Apr. 4, 2024. [Online]. Available: https://worldwide.espacenet.com/patent/search/family/074141311/publication/US2024102987A1
- Confirmation
-
It looks like you're in the . If this is not your location, please select the correct region or country below.
You're headed to Hamamatsu Photonics website for GB (English). If you want to view an other country's site, the optimized information will be provided by selecting options below.
In order to use this website comfortably, we use cookies. For cookie details please see our cookie policy.
- Cookie Policy
-
This website or its third-party tools use cookies, which are necessary to its functioning and required to achieve the purposes illustrated in this cookie policy. By closing the cookie warning banner, scrolling the page, clicking a link or continuing to browse otherwise, you agree to the use of cookies.
Hamamatsu uses cookies in order to enhance your experience on our website and ensure that our website functions.
You can visit this page at any time to learn more about cookies, get the most up to date information on how we use cookies and manage your cookie settings. We will not use cookies for any purpose other than the ones stated, but please note that we reserve the right to update our cookies.
1. What are cookies?
For modern websites to work according to visitor’s expectations, they need to collect certain basic information about visitors. To do this, a site will create small text files which are placed on visitor’s devices (computer or mobile) - these files are known as cookies when you access a website. Cookies are used in order to make websites function and work efficiently. Cookies are uniquely assigned to each visitor and can only be read by a web server in the domain that issued the cookie to the visitor. Cookies cannot be used to run programs or deliver viruses to a visitor’s device.
Cookies do various jobs which make the visitor’s experience of the internet much smoother and more interactive. For instance, cookies are used to remember the visitor’s preferences on sites they visit often, to remember language preference and to help navigate between pages more efficiently. Much, though not all, of the data collected is anonymous, though some of it is designed to detect browsing patterns and approximate geographical location to improve the visitor experience.
Certain type of cookies may require the data subject’s consent before storing them on the computer.
2. What are the different types of cookies?
This website uses two types of cookies:
- First party cookies. For our website, the first party cookies are controlled and maintained by Hamamatsu. No other parties have access to these cookies.
- Third party cookies. These cookies are implemented by organizations outside Hamamatsu. We do not have access to the data in these cookies, but we use these cookies to improve the overall website experience.
3. How do we use cookies?
This website uses cookies for following purposes:
- Certain cookies are necessary for our website to function. These are strictly necessary cookies and are required to enable website access, support navigation or provide relevant content. These cookies direct you to the correct region or country, and support security and ecommerce. Strictly necessary cookies also enforce your privacy preferences. Without these strictly necessary cookies, much of our website will not function.
- Analytics cookies are used to track website usage. This data enables us to improve our website usability, performance and website administration. In our analytics cookies, we do not store any personal identifying information.
- Functionality cookies. These are used to recognize you when you return to our website. This enables us to personalize our content for you, greet you by name and remember your preferences (for example, your choice of language or region).
- These cookies record your visit to our website, the pages you have visited and the links you have followed. We will use this information to make our website and the advertising displayed on it more relevant to your interests. We may also share this information with third parties for this purpose.
Cookies help us help you. Through the use of cookies, we learn what is important to our visitors and we develop and enhance website content and functionality to support your experience. Much of our website can be accessed if cookies are disabled, however certain website functions may not work. And, we believe your current and future visits will be enhanced if cookies are enabled.
4. Which cookies do we use?
There are two ways to manage cookie preferences.
- You can set your cookie preferences on your device or in your browser.
- You can set your cookie preferences at the website level.
If you don’t want to receive cookies, you can modify your browser so that it notifies you when cookies are sent to it or you can refuse cookies altogether. You can also delete cookies that have already been set.
If you wish to restrict or block web browser cookies which are set on your device then you can do this through your browser settings; the Help function within your browser should tell you how. Alternatively, you may wish to visit www.aboutcookies.org, which contains comprehensive information on how to do this on a wide variety of desktop browsers.
5. What are Internet tags and how do we use them with cookies?
Occasionally, we may use internet tags (also known as action tags, single-pixel GIFs, clear GIFs, invisible GIFs and 1-by-1 GIFs) at this site and may deploy these tags/cookies through a third-party advertising partner or a web analytical service partner which may be located and store the respective information (including your IP-address) in a foreign country. These tags/cookies are placed on both online advertisements that bring users to this site and on different pages of this site. We use this technology to measure the visitors' responses to our sites and the effectiveness of our advertising campaigns (including how many times a page is opened and which information is consulted) as well as to evaluate your use of this website. The third-party partner or the web analytical service partner may be able to collect data about visitors to our and other sites because of these internet tags/cookies, may compose reports regarding the website’s activity for us and may provide further services which are related to the use of the website and the internet. They may provide such information to other parties if there is a legal requirement that they do so, or if they hire the other parties to process information on their behalf.
If you would like more information about web tags and cookies associated with on-line advertising or to opt-out of third-party collection of this information, please visit the Network Advertising Initiative website http://www.networkadvertising.org.
6. Analytics and Advertisement Cookies
We use third-party cookies (such as Google Analytics) to track visitors on our website, to get reports about how visitors use the website and to inform, optimize and serve ads based on someone's past visits to our website.
You may opt-out of Google Analytics cookies by the websites provided by Google:
https://tools.google.com/dlpage/gaoptout?hl=en
As provided in this Privacy Policy (Article 5), you can learn more about opt-out cookies by the website provided by Network Advertising Initiative:
http://www.networkadvertising.org
We inform you that in such case you will not be able to wholly use all functions of our website.
Close