![]()
Products


We are actively taking measures to improve product quality levels.
Applications


Why Hamamatsu?
Resources


Support


Our company


Investors


United Kingdom (EN)
Select your region or country.
Mini-spectrometer
- How are spectrophotometric measurements made in a mini-spectrometer?
- What types of image sensors are incorporated in mini-spectrometers?
- What is the integration time?
- What should I know about setting the integration time?
- How are mini-spectrometers driven?
- Is software for operating a mini-spectrometer available?
- What else can the evaluation software do besides basic functions?
- I need to convert each pixel data of the image sensor into wavelength data. How can I do it?
- Can mini-spectrometer A/D-converted values be converted to light levels?
- Are user's manual and technical information also provided?
- Are optical fibers for connecting to mini-spectrometers available?
- How often is wavelength calibration needed? How can I do it?
- What type of grating is incorporated in mini-spectrometers.
- How does the slit size affect detection?
- Can an optical fiber with an FC connector be connected to mini-spectrometers?
- What should I be careful of when connecting a commercially available fiber to a mini-spectrometer?
- How is spectral resolution defined?
- What is the extent of wavelength reproducibility in mini-spectrometers?
- What is the definition of the stray light level?
- Can you offer custom mini-spectrometers?
How are spectrophotometric measurements made in a mini-spectrometer?
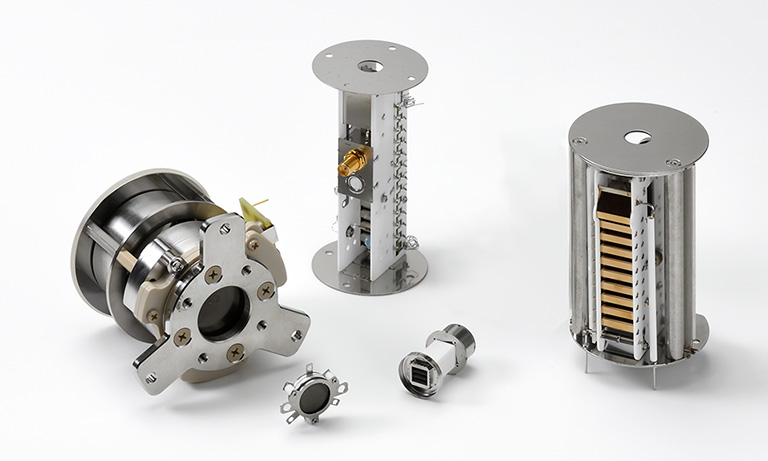
Light incident on a mini-spectrometer is spectrally separated by the grating and arrayed one-dimensionally by wavelength. This light then enters the image sensor and the wavelength information is obtained by reading out the electrical signals that are output at each incident light position on the image sensor. The image sensor consists of an array of photoelectric conversion elements and a circuit for transferring the output charges to an external device. We call mini-spectrometers containing only these components “head type.”
We also provide mini-spectrometers called “module type,“ which includes a head type mini-spectrometer configuration, a driver circuit, and an interface circuit for connecting to a PC. For head type mini-spectrometers, we offer an evaluation circuit (sold separately) designed to connect to a PC.
What types of image sensors are incorporated in mini-spectrometers?
Linear image sensors with different spectral response ranges and sensitivity, etc. are used according to each type of mini-spectrometers.
| Mini-spectrometer (example) | Type | Image sensor | Spectral response range | Features |
|---|---|---|---|---|
| TG series (C9405CC, etc.) TM series (C10082CA, etc.) |
Module type | Back-thinned CCD image sensor | 200 to 1100 nm | High sensitivity |
| TM series (C10082MD, etc.) |
Module type | CMOS image sensor | 200 to 1100 nm | Wide dynamic range |
| MS series Micro series |
Head type | CMOS image sensor | 200 to 1100 nm | Wide dynamic range |
| TG series (C11482GA) | Module type | Non-cooled InGaAs image sensor | 900 to 1700 nm | Power supply for cooling is not required. |
| TG series (C9914GB, etc.) |
Module type | Thermoelectrically cooled InGaAs image sensor |
900 to 2550 nm | Low noise |
What is the integration time?
The integration time is the time for accumulating the electrical charge generated in an image sensor by input of light. The amount of the accumulated electrical charge is proportional to this integration time, so if the incident light level is low, a sufficient amount of charge can be obtained by making the integration time longer. Note, however, that the image sensor dark output also increases in proportion to the integration time.
What should I know about setting the integration time?
The integration time can be set in 1 μs or 1 ms steps. (The integration time for head type mini-spectrometers is set by the timing of image sensor drive signals.)
How are mini-spectrometers driven?
Module type mini-spectrometers have a USB interface and so can be driven by connecting to a Windows PC using the supplied USB cable. Some mini-spectrometers operate only on USB bus power, and others require an external power supply. When using a mini-spectrometer requiring an external power supply, use the power supply connector that comes with the product.
| USB bus power only | C10082MD, C10083MD, C11697MB, C11482GA, C13053MA |
|---|---|
| USB bus power + external power supply | C10082CA, C10082CAH, C10083CA, C10083CAH, C9913GC, C9914GB, C11118GA |
Note 1: To operate a head type mini-spectrometer, please prepare a driver circuit that meets the conditions needed for installation into equipment. We provide an evaluation circuit (sold separately) for simple evaluation of head type mini-spectrometer characteristics.
Note 2: Precautions for USB bus power
USB bus power has an upper limit in terms of current consumption. Caution is therefore needed when using a bus-powered type hub that draws power through a connected port or when used along with another USB bus powered device or when connected to multiple mini-spectrometers.
On some PC (especially notebook PC) depending on their settings, the power supplied from the USB bus may shut off when the PC shifts to power-saving mode. Communication problems with the mini-spectrometer may also occur when recovering from power-saving mode. So power-saving mode should be disabled.
Is software for operating a mini-spectrometer available?
Mini-spectrometers (except for head type mini-spectrometers) come supplied with evaluation software.
This evaluation software includes the functions (setting measurement conditions, acquiring and storing data, and displaying graphs, etc.) needed for making basic measurements.
What else can the evaluation software do besides basic functions?
The evaluation software can store measurement results as a CSV file (wavelength or pixel is selectable with the button). This file can be loaded on other software for further processing. The evaluation software is also supplied with a DLL that is usable with Visual C++, Visual Basic, etc., allowing users to develop their own measurement programs. However, the DLL function specifications of the evaluation circuit for head type mini-spectrometers are not available to users.
I need to convert each pixel data of the image sensor into wavelength data. How can I do it?
The relation between each image sensor pixel and the wavelength can be calculated by using the following 5-order approximate expression.
Wavelength [nm] = a0 + a1pix1 + a2pix2 + a3pix3 + a4pix4 + a5pix5
a0~a5: wavelength conversion factors listed on final inspection sheet
These wavelength conversion factors are internally stored in mini-spectrometers (other than head type mini-spectrometers).
pix: any pixel number (1 to last pixel) of image sensor
The evaluation software can use these factors to display data converted into wavelengths.
Please be aware that the values calculated with this approximate expression may show a slight difference when comparing with the known wavelengths of spectral lines.
Can mini-spectrometer A/D-converted values be converted to light levels?
This is not possible because the mini-spectrometer does not have coefficients for converting A/D-converted values to light levels.
Are user's manual and technical information also provided?
When the evaluation software is installed in the PC, the user's manual and technical information are also stored in the PC.
To view these items, from the Windows Start menu, select:
[Program]→[Hamamatsuminispectrometer]→[Document]
Are optical fibers for connecting to mini-spectrometers available?
The following optical fibers are available (sold separately).
*A16962-01: for UV to visible, 600 µm core diameter, 1.5 m long, with SMA905D connector on both ends
*A16962-02: for UV to visible, 800 µm core diameter, 1.5 m long, with SMA905D connector on both ends
*A16963-01: for visible to NIR, 600 µm core diameter, 1.5 m long, with SMA905D connector on both ends
*A16963-02: for visible to NIR, 800 µm core diameter,1.5 m long, with SMA905D connector on both ends
Note: MS series and micro-spectrometers do not require an optical fiber since they are designed to measure light that is incident through air.
How often is wavelength calibration needed? How can I do it?
Hamamatsu mini-spectrometers have no moving parts and so possess excellent stability. We think there is no need to perform wavelength calibration when used under normal environment such as an indoor area. You can continue using the wavelength conversion factors that are attached at the time of shipment.
Wavelength precision can be checked using calibration lamps that emit already known spectral lines. To reacquire wavelength conversion factors, we recommend using a high-precision monochromator.
What type of grating is incorporated in mini-spectrometers.
Our mini-spectrometers use a transmission type grating or reflection type grating.
How does the slit size affect detection?
In mini-spectrometers, the slit size is mainly related to resolution and throughput. The smaller the slit size especially along the width, the more the resolution improves. However, making the slit smaller decreases the light level to be measured and also causes the throughput of the mini-spectrometer to drop. The mini-spectrometer slit size is set while taking these factors into account.
Can an optical fiber with an FC connector be connected to mini-spectrometers?
Our mini-spectrometers (for optical fiber connection) come supplied with an SMA connector. Optical fibers with an FC connector cannot be coupled to our mini-spectrometers.
Note: The MS series and micro-spectrometers do not require an optical fiber since they measure light that is incident through air.
What should I be careful of when connecting a commercially available fiber to a mini-spectrometer?
Use an optical fiber with an SMA connector and having NA 0.22 and a large core diameter (core diameter of 500 μm or more is recommended). Optical fibers with a small core diameter sometimes affect the measurement accuracy. To reduce noise, select an optical fiber covered with a sheath that is not affected by external light. If measuring ultraviolet light, then select a solarization-resistant optical fiber to prevent loss of transmittance.
How is spectral resolution defined?
There are two methods for defining spectral resolution. One defines the resolution by DIN standards using the Rayleigh criterion. Here a numerical value defines to what extent the mini-spectrometer can differentiate the wavelength difference between peaks at the same intensity and adjacent to each other. In this method, the valley between the two peaks must be measurable within 81% or less of the peak value. On the other hand, a more practical method for defining spectral resolution is finding the spectral width by FWHM (full width at half maximum). This method directly defines the broadening of the spectrum at a point that is 50% of the intensity of the spectral peak value. Resolution defined by the half-width (FWHM) is known as about 80% of the resolution value defined by Rayleigh criterion. The spectral resolution of mini-spectrometers is defined by the more practical half-width (FWHM) method.
What is the extent of wavelength reproducibility in mini-spectrometers?
Since mini-spectrometers have no mechanically moving parts, their optical precision can be easily maintained so that they provide high wavelength reproducibility. For example, the C9404CA achieves wavelength reproducibility of ±0.1 nm, and the C9406GC offer wavelength reproducibility of ±0.2 nm. The TG series and TM series mini-spectrometers have a compact and robust optical system that minimizes the effects of temperature on wavelength. This allows the above models to attain specifications of 0.02 nm/°C.
What is the definition of the stray light level?
There are two methods for defining the stray light level. One method utilizes the white light transmitted through a long-pass filter that passes a specific wavelength as the measurement light. Stray light is in this case defined as the ratio of transmittance in the transmitted wavelength range to the blocked wavelength range. This definition permits measuring the effect of stray light in a wide wavelength range and so is an evaluation method that fits actual applications such as fluorescence measurement. However, the user should be aware that the intensity profile of white light used as the reference light will have effects on the measurement value. The other method utilizes reference light in a narrow wavelength range such as light emitted from a monochromator or a spectral line lamp. In this case, one example for defining the stray light is given by the equation below using a reference light level and the amount of unnecessary light that is output at a position shifted from the peak wavelength of the reference light in a narrow wavelength range. If evaluating stray light by means of reference light in a narrow wavelength range, then the measurement conditions are very simple, so this method offers good reproducibility when making quantitative evaluations.
SL = 10 × (log IM / IR)
SL : stray light by means of reference light in a narrow wavelength range
IM : amount of unnecessary light that is output at a position shifted from the peak wavelength of the reference light
IR : reference light level
Can you offer custom mini-spectrometers?
Since all components are designed in-house, we are able to offer flexible solutions for custom orders.
Please note that depending on the specific customization details or the model of the mini-spectrometer, we may not be able to accommodate all requests. Please feel free to contact us for more details.
- Confirmation
-
It looks like you're in the . If this is not your location, please select the correct region or country below.
You're headed to Hamamatsu Photonics website for GB (English). If you want to view an other country's site, the optimized information will be provided by selecting options below.
In order to use this website comfortably, we use cookies. For cookie details please see our cookie policy.
- Cookie Policy
-
This website or its third-party tools use cookies, which are necessary to its functioning and required to achieve the purposes illustrated in this cookie policy. By closing the cookie warning banner, scrolling the page, clicking a link or continuing to browse otherwise, you agree to the use of cookies.
Hamamatsu uses cookies in order to enhance your experience on our website and ensure that our website functions.
You can visit this page at any time to learn more about cookies, get the most up to date information on how we use cookies and manage your cookie settings. We will not use cookies for any purpose other than the ones stated, but please note that we reserve the right to update our cookies.
1. What are cookies?
For modern websites to work according to visitor’s expectations, they need to collect certain basic information about visitors. To do this, a site will create small text files which are placed on visitor’s devices (computer or mobile) - these files are known as cookies when you access a website. Cookies are used in order to make websites function and work efficiently. Cookies are uniquely assigned to each visitor and can only be read by a web server in the domain that issued the cookie to the visitor. Cookies cannot be used to run programs or deliver viruses to a visitor’s device.
Cookies do various jobs which make the visitor’s experience of the internet much smoother and more interactive. For instance, cookies are used to remember the visitor’s preferences on sites they visit often, to remember language preference and to help navigate between pages more efficiently. Much, though not all, of the data collected is anonymous, though some of it is designed to detect browsing patterns and approximate geographical location to improve the visitor experience.
Certain type of cookies may require the data subject’s consent before storing them on the computer.
2. What are the different types of cookies?
This website uses two types of cookies:
- First party cookies. For our website, the first party cookies are controlled and maintained by Hamamatsu. No other parties have access to these cookies.
- Third party cookies. These cookies are implemented by organizations outside Hamamatsu. We do not have access to the data in these cookies, but we use these cookies to improve the overall website experience.
3. How do we use cookies?
This website uses cookies for following purposes:
- Certain cookies are necessary for our website to function. These are strictly necessary cookies and are required to enable website access, support navigation or provide relevant content. These cookies direct you to the correct region or country, and support security and ecommerce. Strictly necessary cookies also enforce your privacy preferences. Without these strictly necessary cookies, much of our website will not function.
- Analytics cookies are used to track website usage. This data enables us to improve our website usability, performance and website administration. In our analytics cookies, we do not store any personal identifying information.
- Functionality cookies. These are used to recognize you when you return to our website. This enables us to personalize our content for you, greet you by name and remember your preferences (for example, your choice of language or region).
- These cookies record your visit to our website, the pages you have visited and the links you have followed. We will use this information to make our website and the advertising displayed on it more relevant to your interests. We may also share this information with third parties for this purpose.
Cookies help us help you. Through the use of cookies, we learn what is important to our visitors and we develop and enhance website content and functionality to support your experience. Much of our website can be accessed if cookies are disabled, however certain website functions may not work. And, we believe your current and future visits will be enhanced if cookies are enabled.
4. Which cookies do we use?
There are two ways to manage cookie preferences.
- You can set your cookie preferences on your device or in your browser.
- You can set your cookie preferences at the website level.
If you don’t want to receive cookies, you can modify your browser so that it notifies you when cookies are sent to it or you can refuse cookies altogether. You can also delete cookies that have already been set.
If you wish to restrict or block web browser cookies which are set on your device then you can do this through your browser settings; the Help function within your browser should tell you how. Alternatively, you may wish to visit www.aboutcookies.org, which contains comprehensive information on how to do this on a wide variety of desktop browsers.
5. What are Internet tags and how do we use them with cookies?
Occasionally, we may use internet tags (also known as action tags, single-pixel GIFs, clear GIFs, invisible GIFs and 1-by-1 GIFs) at this site and may deploy these tags/cookies through a third-party advertising partner or a web analytical service partner which may be located and store the respective information (including your IP-address) in a foreign country. These tags/cookies are placed on both online advertisements that bring users to this site and on different pages of this site. We use this technology to measure the visitors' responses to our sites and the effectiveness of our advertising campaigns (including how many times a page is opened and which information is consulted) as well as to evaluate your use of this website. The third-party partner or the web analytical service partner may be able to collect data about visitors to our and other sites because of these internet tags/cookies, may compose reports regarding the website’s activity for us and may provide further services which are related to the use of the website and the internet. They may provide such information to other parties if there is a legal requirement that they do so, or if they hire the other parties to process information on their behalf.
If you would like more information about web tags and cookies associated with on-line advertising or to opt-out of third-party collection of this information, please visit the Network Advertising Initiative website http://www.networkadvertising.org.
6. Analytics and Advertisement Cookies
We use third-party cookies (such as Google Analytics) to track visitors on our website, to get reports about how visitors use the website and to inform, optimize and serve ads based on someone's past visits to our website.
You may opt-out of Google Analytics cookies by the websites provided by Google:
https://tools.google.com/dlpage/gaoptout?hl=en
As provided in this Privacy Policy (Article 5), you can learn more about opt-out cookies by the website provided by Network Advertising Initiative:
http://www.networkadvertising.org
We inform you that in such case you will not be able to wholly use all functions of our website.
Close